
Elementary Statistics: A Step By Step Approach
9th Edition
ISBN: 9780073534985
Author: Allan Bluman
Publisher: McGraw-Hill Science/Engineering/Math
expand_more
expand_more
format_list_bulleted
Concept explainers
Videos
Textbook Question
Chapter 10.2, Problem 15E
For Exercises 11 through 27, use the same data as for the corresponding exercises in Section 10–1. For each exercise, find the equation of the regression line and find the y′ value for the specified x value. Remember that no regression should be done when r is not significant.
15. Alumni Contributions Years and contribution data are as follows:
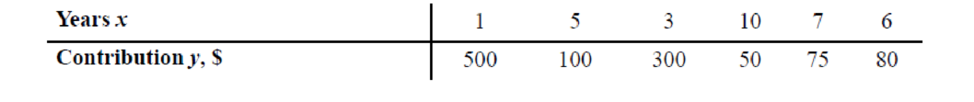
Find y′ when x = 4 years.
Expert Solution & Answer
Want to see the full answer?
Check out a sample textbook solution
Students have asked these similar questions
Given are five observations collected in a regression study on two variables.
a. Which of the following scatter diagrams accurately represents the data? B
(NEED ANSWERS FOR B and C)
b. Develop the estimated regression equation for these data (to 1 decimal).
c. Use the estimated regression equation to predict the value of Y when X=6 (1 decimal)
Run a regression analysis on the following data set, where yy is the final grade in a math class and xx is the average number of hours the student spent working on math each week.
hours/weekx
Gradey
4
50.6
7
50.8
7
62.8
8
58.2
8
55.2
8
73.2
11
78.4
13
78.2
17
90.8
20
100
State the regression equation y=m⋅x+by=m⋅x+b, with constants accurate to two decimal places. What is the predicted value for the final grade when a student spends an average of 14 hours each week on math?Grade = Round to 1 decimal place.
Draw the regression line for the following equation:
Y = -3 + (1) X
Show your calculation for a low and high value on the predictor value.
Chapter 10 Solutions
Elementary Statistics: A Step By Step Approach
Ch. 10.1 - Stopping Distances In a study on speed control, it...Ch. 10.1 - What is meant by the statement that two variables...Ch. 10.1 - How is a linear relationship between two variables...Ch. 10.1 - What is the symbol for the sample correlation...Ch. 10.1 - What is the range of values for the correlation...Ch. 10.1 - What is meant when the relationship between the...Ch. 10.1 - Prob. 6ECh. 10.1 - What is the diagram of the independent and...Ch. 10.1 - What is the name of the correlation coefficient...Ch. 10.1 - What statistical test is used to test the...
Ch. 10.1 - When two variables are correlated, can the...Ch. 10.1 - For Exercises 11 through 27, perform the following...Ch. 10.1 - Prob. 12ECh. 10.1 - Prob. 13ECh. 10.1 - For Exercises 11 through 27, perform the following...Ch. 10.1 - For Exercises 11 through 27, perform the following...Ch. 10.1 - For Exercises 11 through 27, perform the following...Ch. 10.1 - Prob. 17ECh. 10.1 - Prob. 18ECh. 10.1 - Prob. 19ECh. 10.1 - For Exercises 11 through 27, perform the following...Ch. 10.1 - For Exercises 11 through 27, perform the following...Ch. 10.1 - For Exercises 11 through 27, perform the following...Ch. 10.1 - Prob. 23ECh. 10.1 - For Exercises 11 through 27, perform the following...Ch. 10.1 - Prob. 25ECh. 10.1 - Prob. 26ECh. 10.1 - Prob. 27ECh. 10.1 - Prob. 28ECCh. 10.1 - Prob. 29ECCh. 10.1 - Prob. 30ECCh. 10.2 - Applying the Concepts 102 Stopping Distances...Ch. 10.2 - What two things should be done before one performs...Ch. 10.2 - What are the assumptions for regression analysis?Ch. 10.2 - Prob. 3ECh. 10.2 - What is the symbol for the slope? For the y...Ch. 10.2 - Prob. 5ECh. 10.2 - When all the points fall on the regression line,...Ch. 10.2 - What is the relationship between the sign of the...Ch. 10.2 - As the value of the correlation coefficient...Ch. 10.2 - Prob. 9ECh. 10.2 - When the value of r is not significant, what value...Ch. 10.2 - For Exercises 11 through 27, use the same data as...Ch. 10.2 - Prob. 12ECh. 10.2 - For Exercises 11 through 27, use the same data as...Ch. 10.2 - For Exercises 11 through 27, use the same data as...Ch. 10.2 - For Exercises 11 through 27, use the same data as...Ch. 10.2 - For Exercises 11 through 27, use the same data as...Ch. 10.2 - Prob. 17ECh. 10.2 - Prob. 18ECh. 10.2 - Prob. 19ECh. 10.2 - For Exercises 11 through 27, use the same data as...Ch. 10.2 - For Exercises 11 through 27, use the same data as...Ch. 10.2 - For Exercises 11 through 27, use the same data as...Ch. 10.2 - For Exercises 11 through 27, use the same data as...Ch. 10.2 - For Exercises 11 through 27, use the same data as...Ch. 10.2 - Prob. 25ECh. 10.2 - Prob. 26ECh. 10.2 - For Exercises 11 through 27, use the same data as...Ch. 10.2 - Prob. 28ECh. 10.2 - Prob. 29ECh. 10.2 - For Exercises 28 through 33, do a complete...Ch. 10.2 - For Exercises 28 through 33, do a complete...Ch. 10.2 - For Exercises 28 through 33, do a complete...Ch. 10.2 - Prob. 33ECh. 10.2 - For Exercises 34 and 35, do a complete regression...Ch. 10.2 - For Exercises 34 and 35, do a complete regression...Ch. 10.2 - For Exercises 13, 15, and 21 in Section 101, find...Ch. 10.2 - Prob. 37ECCh. 10.2 - The value of the correlation coefficient can also...Ch. 10.3 - Applying the Concepts 103 Interpreting Simple...Ch. 10.3 - What is meant by the explained variation? How is...Ch. 10.3 - What is meant by the unexplained variation? How is...Ch. 10.3 - What is meant by the total variation? How is it...Ch. 10.3 - Define the coefficient of determination.Ch. 10.3 - How is the coefficient of determination found?Ch. 10.3 - Define the coefficient of nondetermination.Ch. 10.3 - How is the coefficient of nondetermination found?Ch. 10.3 - Prob. 8ECh. 10.3 - Prob. 9ECh. 10.3 - Prob. 10ECh. 10.3 - Prob. 11ECh. 10.3 - Prob. 12ECh. 10.3 - Prob. 13ECh. 10.3 - Prob. 14ECh. 10.3 - Prob. 15ECh. 10.3 - Compute the standard error of the estimate for...Ch. 10.3 - Compute the standard error of the estimate for...Ch. 10.3 - Compute the standard error of the estimate for...Ch. 10.3 - Prob. 19ECh. 10.3 - For the data in Exercises 14 in Sections 101 and...Ch. 10.3 - Prob. 21ECh. 10.3 - Prob. 22ECh. 10.4 - Applying the Concepts 104 More Math Means More...Ch. 10.4 - Explain the similarities and differences between...Ch. 10.4 - What is the general form of the multiple...Ch. 10.4 - Prob. 3ECh. 10.4 - Prob. 4ECh. 10.4 - How do the values of the individual correlation...Ch. 10.4 - Age, GPA, and Income A researcher has determined...Ch. 10.4 - Prob. 7ECh. 10.4 - Prob. 8ECh. 10.4 - Aspects of Students Academic Behavior A college...Ch. 10.4 - Age, Cholesterol, and Sodium A medical researcher...Ch. 10.4 - Explain the meaning of the multiple correlation...Ch. 10.4 - What is the range of values R can assume?Ch. 10.4 - Prob. 13ECh. 10.4 - What are the hypotheses used to test the...Ch. 10.4 - What test is used to test the significance of R?Ch. 10.4 - What is the meaning of the adjusted R2? Why is it...Ch. 10 - Prob. 10.1.1RECh. 10 - For Exercises 1 through 7, do a complete...Ch. 10 - Prob. 10.1.3RECh. 10 - For Exercises 1 through 7, do a complete...Ch. 10 - For Exercises 1 through 7, do a complete...Ch. 10 - For Exercises 1 through 7, do a complete...Ch. 10 - Prob. 10.1.7RECh. 10 - For Exercise 4, find the standard error of the...Ch. 10 - Prob. 10.2.9RECh. 10 - Prob. 10.2.10RECh. 10 - Prob. 10.2.11RECh. 10 - Prob. 10.2.12RECh. 10 - (Opt.) A study found a significant relationship...Ch. 10 - Prob. 10.2.14RECh. 10 - Prob. 10.2.15RECh. 10 - Prob. 1DACh. 10 - Prob. 2DACh. 10 - Prob. 3DACh. 10 - Prob. 1CQCh. 10 - Determine whether each statement is true or false....Ch. 10 - Determine whether each statement is true or false....Ch. 10 - Determine whether each statement is true or false....Ch. 10 - Determine whether each statement is true or false....Ch. 10 - Determine whether each statement is true or false....Ch. 10 - Prob. 7CQCh. 10 - Select the best answer. 8. To test the...Ch. 10 - Select the best answer. 9. The test of...Ch. 10 - Prob. 10CQCh. 10 - Prob. 11CQCh. 10 - Prob. 12CQCh. 10 - Complete the following statements with the best...Ch. 10 - Prob. 14CQCh. 10 - Prob. 15CQCh. 10 - Prob. 16CQCh. 10 - Prob. 17CQCh. 10 - Prob. 18CQCh. 10 - Prob. 19CQCh. 10 - Prob. 20CQCh. 10 - Prob. 21CQCh. 10 - Prob. 22CQCh. 10 - Prob. 23CQCh. 10 - For Exercise 20, find the 90% prediction interval...Ch. 10 - Prob. 25CQCh. 10 - Prob. 26CQCh. 10 - (Opt.) Find R when ryx1 = 0.561 and ryx2 = 0.714...Ch. 10 - Prob. 28CQCh. 10 - Prob. 1CTCCh. 10 - Prob. 2CTCCh. 10 - Prob. 3CTCCh. 10 - Prob. 4CTCCh. 10 - Product Sales When the points in a scatter plot...Ch. 10 - Prob. 6CTCCh. 10 - Prob. 7CTCCh. 10 - Product Sales When the points in a scatter plot...Ch. 10 - Prob. 9CTC
Knowledge Booster


Learn more about
Need a deep-dive on the concept behind this application? Look no further. Learn more about this topic, statistics and related others by exploring similar questions and additional content below.Similar questions
- The following fictitious table shows kryptonite price, in dollar per gram, t years after 2006. t= Years since 2006 0 1 2 3 4 5 6 7 8 9 10 K= Price 56 51 50 55 58 52 45 43 44 48 51 Make a quartic model of these data. Round the regression parameters to two decimal places.arrow_forwardFind the equation of the regression line for the following data set. x 1 2 3 y 0 3 4arrow_forwardThe prelim grades (x) and midterm grades (y) of a sample of 10 MMW students is modeled by the regression line y = 12.0623 + 0.7771x. Estimate the prelim grade if the midterm grade is 83.arrow_forward
- Draw the regression line for the following equation: Y = -3 + (1) Xarrow_forwardBased on the below table, compute the regression line that predicts Y from X. (relevant section) MX MY sX sY r 10 12 2.5 3.0 -0.6arrow_forwardGiven are five observations for two variables, x and y. x 1 2 3 4 5 y 4 7 7 11 13 Develop the estimated regression equation by computing the values of b0 and b1 (to 1 decimals).y=___________ + ___________xUse the estimated regression equation to predict the value of y when x=3 (to 1 decimals). y=___________arrow_forward
- A set of X and Y scores Mx=4, SSx=10, My=5, SSy=40, SP=20. What is the regression equation for predicting Y from X/arrow_forwardA set of X and Y scores has Mx=4, SSx=10, My=5, SSy = 40, and SP=20. What is the regression equation for predicting Y from X?arrow_forwardFind the slope (b1) for the regression equation for the following values. Round to 3 decimal places. Define Variables xi yi 33 180 25 170 50 200 65 186 57 160 27 165arrow_forward
arrow_back_ios
arrow_forward_ios
Recommended textbooks for you
 Functions and Change: A Modeling Approach to Coll...AlgebraISBN:9781337111348Author:Bruce Crauder, Benny Evans, Alan NoellPublisher:Cengage Learning
 Algebra & Trigonometry with Analytic GeometryAlgebraISBN:9781133382119Author:SwokowskiPublisher:Cengage
Functions and Change: A Modeling Approach to Coll...
Algebra
ISBN:9781337111348
Author:Bruce Crauder, Benny Evans, Alan Noell
Publisher:Cengage Learning
Algebra & Trigonometry with Analytic Geometry
Algebra
ISBN:9781133382119
Author:Swokowski
Publisher:Cengage
Correlation Vs Regression: Difference Between them with definition & Comparison Chart; Author: Key Differences;https://www.youtube.com/watch?v=Ou2QGSJVd0U;License: Standard YouTube License, CC-BY
Correlation and Regression: Concepts with Illustrative examples; Author: LEARN & APPLY : Lean and Six Sigma;https://www.youtube.com/watch?v=xTpHD5WLuoA;License: Standard YouTube License, CC-BY