Essentials Of Statistics For Business & Economics
9th Edition
ISBN: 9780357045435
Author: David R. Anderson, Dennis J. Sweeney, Thomas A. Williams, Jeffrey D. Camm, James J. Cochran
Publisher: South-Western College Pub
bartleby

Concept explainers

bartleby

Videos

Textbook Question
Book Icon
Chapter 10.2, Problem 16E

Effect of Parents’ Education on Student SAT Scores. The College Board provided comparisons of Scholastic Aptitude Test (SAT) scores based on the highest level of education attained by the test taker’s parents. A research hypothesis was that students whose parents had attained a higher level of education would on aver age score higher on the SAT. The overall mean SAT math score was 514. SAT math scores for independent samples of students follow. The first sample shows the SAT math test scores for students whose parents are college graduates with a bachelor’s degree. The second sample shows the SAT math test scores for students whose parents are high school graduates but do not have a college degree.

Chapter 10.2, Problem 16E, Effect of Parents’ Education on Student SAT Scores. The College Board provided comparisons of

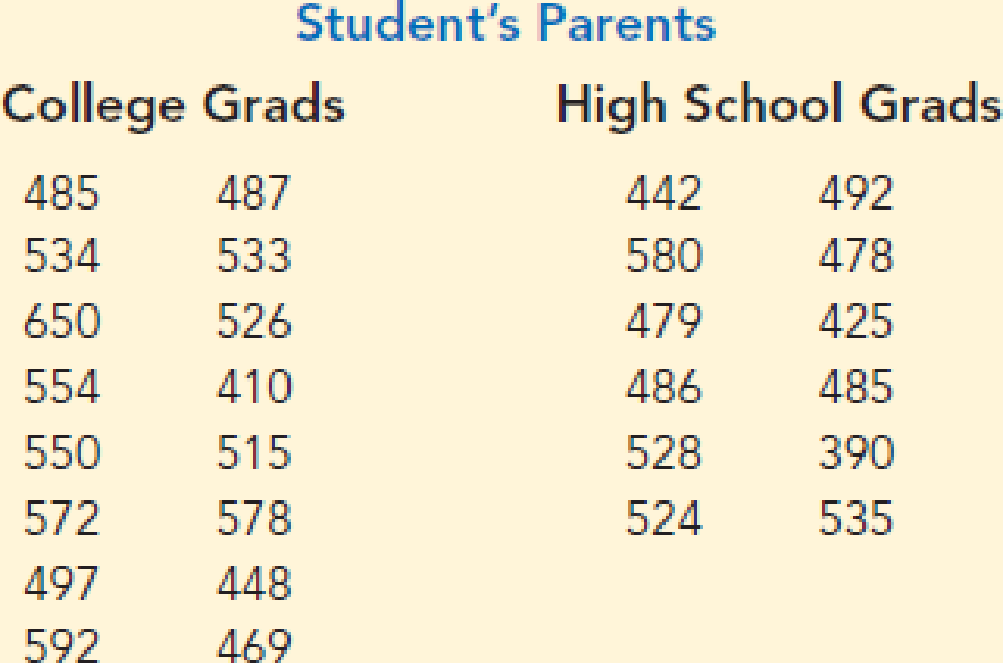
  1. a. Formulate the hypotheses that can be used to determine whether the sample data support the hypothesis that students show a higher population mean math score on the SAT if their parents attained a higher level of education.
  2. b. What is the point estimate of the difference between the means for the two populations?
  3. c. Compute the p-value for the hypothesis test.
  4. d. At α = .05, what is your conclusion?
Blurred answer
Students have asked these similar questions
The following table describes the probability distribution of the number of Mexican-Americans serving on a 12-member jury in Hidalgo County, Texas. Assuming we repeat the random selection process for the 12 jurors and count the number of Mexican-Americans each time, calculate the mean number of Mexican-Americans (out of 12), the variance, and the standard deviation. Use these results and the interval rule of thumb to calculate the highest common value and the lowest common value. Based on the results, determine whether a jury consisting of 7 Mexican-Americans out of 12 jurors is common or uncommon. Probability distribution: probabilities of numbers of Mexican-Americans on a 12-member jury, assuming the members are randomly selected from a population in which 80% of the inhabitants are Mexican-American x (méxico- estadouni- P(x) denses) 0 0+ 1 0+ 2 0+ 3 0+ 4 0.001 5 0.003 6 0.016 7 0.053 8 0.133 9 0.236 10 0.283 11 0.206 12 0.069
a) When two variables are correlated, can the researcher be sure that one variable causes the other? If YES , why?  If NO , why? b) What is meant by the statement that two variables are related? Discuss with examples.
Good Day, assist me with plotting the following. I've already calculated the System Average Interruption Duration Index and System Average Interruption Frequency Index. using this data  Create time series plots form the reliability metrics SAIDI and SAIFI along with thetrend lines based on the linear regression SAIDI(MINUTES) SAIFI(Interruptions) 2.58 0.045 2.94 0.056 2.32 0.056 3.21 0.177 2.78 0.180 2.72 0.121 2.44 0.119 3.19 0.175 2.21 0.065 2.30 0.135 3.49 0.128 3.60 0.112 2.15 0.104 3.75 0.055 3.12 0.036 2.85 0.123 2.62 0.173 3.08 0.047 1.92 0.040 2.94 0.147

Chapter 10 Solutions

Essentials Of Statistics For Business & Economics

Ch. 10.2 - Consider the following data for two independent...Ch. 10.2 - Miles Driven Per Day. The U.S. Department of...Ch. 10.2 - Annual Cost of College. The increasing annual cost...Ch. 10.2 - Salaries of Recent College Graduates. The Tippie...Ch. 10.2 - Hotel Prices. Hotel room pricing changes over time...Ch. 10.2 - Effect of Parents’ Education on Student SAT...Ch. 10.2 - Comparing Financial Consultant Ratings....Ch. 10.2 - Comparing Length of Flight Delays. The success of...Ch. 10.3 - Consider the following hypothesis test. The...Ch. 10.3 - The following data are from matched samples taken...Ch. 10.3 - Television Commercials and Product Purchase...Ch. 10.3 - First-Quarter Stock Market Performance. The price...Ch. 10.3 - Credit Card Expenditures. Bank of America’s...Ch. 10.3 - Domestic Airfare. The Global Business Travel...Ch. 10.3 - SAT Scores. The College Board SAT college entrance...Ch. 10.3 - PGA Tour Scores. Scores in the first and fourth...Ch. 10.3 - Price Comparison of Smoothie Blenders. A personal...Ch. 10.4 - Consider the following results for independent...Ch. 10.4 - Consider the hypothesis test The following...Ch. 10.4 - Corporate Hiring Outlook. A Businessweek/Harris...Ch. 10.4 - Impact of Pinterest on Purchase Decisions. Forbes...Ch. 10.4 - Mislabeled Fish. Researchers with Oceana, a group...Ch. 10.4 - Voter Turnout. Minnesota had the highest turnout...Ch. 10.4 - Oil Well Drilling. Oil wells are expensive to...Ch. 10.4 - Hotel Occupancy Rates. Tourism is extremely...Ch. 10.4 - Gender Differences in Raise or Promotion...Ch. 10.4 - Default Rates on Bank Loans. Carl Allen and Norm...Ch. 10 - Supermarket Checkout Lane Design. Safegate Foods,...Ch. 10 - SUV Lease Payments. Statista reports that the...Ch. 10 - Load Versus No-Load Mutal Funds. Mutual funds are...Ch. 10 - Kitchen Versus Bedroom Remodeling Costs. The...Ch. 10 - Effect of Siblings on SAT Scores. In Born...Ch. 10 - Change in Financial Security. Country Financial, a...Ch. 10 - Differences in Insurance Claims Based on Marital...Ch. 10 - Drug-Resistant Gonorrhea. Each year, more than 2...Ch. 10 - News Access Via Computer. The American Press...Ch. 10 - Par, Inc., is a major manufacturer of golf...
Knowledge Booster
Background pattern image
Statistics
Learn more about
Need a deep-dive on the concept behind this application? Look no further. Learn more about this topic, statistics and related others by exploring similar questions and additional content below.
Similar questions
SEE MORE QUESTIONS
Recommended textbooks for you
Text book image
College Algebra (MindTap Course List)
Algebra
ISBN:9781305652231
Author:R. David Gustafson, Jeff Hughes
Publisher:Cengage Learning
Text book image
Glencoe Algebra 1, Student Edition, 9780079039897...
Algebra
ISBN:9780079039897
Author:Carter
Publisher:McGraw Hill
Text book image
Holt Mcdougal Larson Pre-algebra: Student Edition...
Algebra
ISBN:9780547587776
Author:HOLT MCDOUGAL
Publisher:HOLT MCDOUGAL
Text book image
College Algebra
Algebra
ISBN:9781938168383
Author:Jay Abramson
Publisher:OpenStax
Text book image
Big Ideas Math A Bridge To Success Algebra 1: Stu...
Algebra
ISBN:9781680331141
Author:HOUGHTON MIFFLIN HARCOURT
Publisher:Houghton Mifflin Harcourt
Statistics 4.1 Point Estimators; Author: Dr. Jack L. Jackson II;https://www.youtube.com/watch?v=2MrI0J8XCEE;License: Standard YouTube License, CC-BY
Statistics 101: Point Estimators; Author: Brandon Foltz;https://www.youtube.com/watch?v=4v41z3HwLaM;License: Standard YouTube License, CC-BY
Central limit theorem; Author: 365 Data Science;https://www.youtube.com/watch?v=b5xQmk9veZ4;License: Standard YouTube License, CC-BY
Point Estimate Definition & Example; Author: Prof. Essa;https://www.youtube.com/watch?v=OTVwtvQmSn0;License: Standard Youtube License
Point Estimation; Author: Vamsidhar Ambatipudi;https://www.youtube.com/watch?v=flqhlM2bZWc;License: Standard Youtube License