
Pearson eText for Statistical Reasoning for Everyday Life -- Instant Access (Pearson+)
5th Edition
ISBN: 9780137561544
Author: Jeffrey Bennett, William Briggs
Publisher: PEARSON+
expand_more
expand_more
format_list_bulleted
Concept explainers
Videos
Textbook Question
Chapter 10.2, Problem 16E
Complete Hypothesis Test. In Exercises 15–22, carry out the following steps.
- a. State the null and alternative hypotheses.
- b. Assuming independence between the two variables, find the expected frequency for each cell of the table.
- c. Find the value of the χ2 statistic.
- d. Use the given significance level to find the χ2 critical value.
- e. Using the given significance level, complete the test of the claim that the two variables are independent. State the conclusion that addresses the original claim.
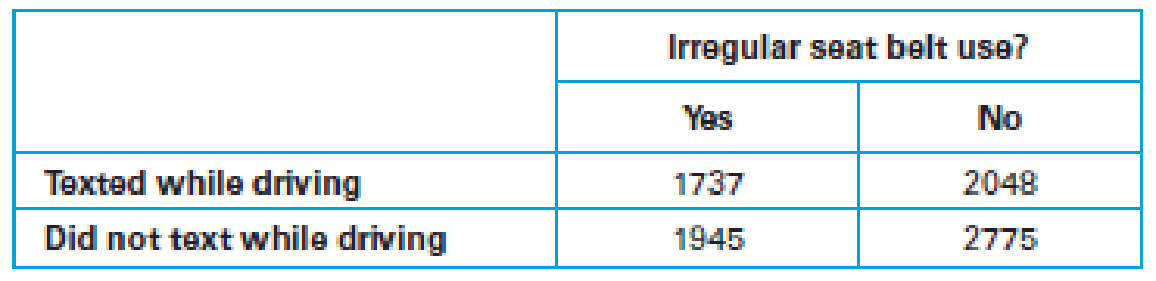
16. Texting and Seat Belt Use. In a study of high school students at least 16 years of age, researchers obtained the survey results summarized in the accompanying table (based on data from “Texting While Driving and Other Risky Motor Vehicle Behaviors Among U.S. High School Students” by O’Malley, Shults, and Eaton, Pediatrics, Vol. 131, No. 6). Use a 0.05 significance level to test the claim of independence between texting while driving and irregular seat belt use. Are those two risky behaviors independent of each other?
Expert Solution & Answer
Want to see the full answer?
Check out a sample textbook solution
Students have asked these similar questions
P -Values. In Exercises 17–20, do the following:
a. Identify the hypothesis test as being two-tailed, left-tailed, or right-tailed.
b. Find the P-value. (See Figure 8-3 on page 364.)
c. Using a significance level of α = 0.05, should we reject H0 or should we fail to reject H0?
The test statistic of z = 2.01 is obtained when testing the claim that p ≠ 0.345.
The following table contains the number of successes and failures for three categories of a variable. Test whether the proportions are equal for each category at the
α=0.1
level of significance.
Category 1
Category 2
Category 3
Failures
32
51
57
Successes
39
54
73
State the hypotheses. Choose the correct answer below.
A.
H0:
The
categories of the variable
and
success and failure
are independent.
H1:
The
categories of the variable
and
success and failure
are dependent.
B.
H0:
The
categories of the variable
and
success and failure
are dependent.
H1:
The
categories of the variable
and
success and failure
are independent.
C.
H0:
p1=p2=p3
H1:
At least one of the proportions is different from the others.
D.
H0:
μ1=E1
and
μ2=E2
and
μ3=E3
H1:
At least one mean is different from what is expected.
What is the P-value?
nothing
(Round to three decimal places as needed.)
What conclusion can be…
Tourism is extremely important to the economy of Florida. Hotel occupancy is an often-reported measure of visitor volume and visitor activity (Orlando Sentinel, May 19, 2018). Hotel occupancy data
for February in two consecutive years are as follows.
Let P₁ = population proportion of rooms occupied for current year
P2 = population proportion of rooms occupied for previous year
Occupied Rooms
Total Rooms
1,360
1,700
1,309
1,700
a. Formulate the hypothesis test that can be used to determine whether there has been an increase in the proportion of rooms occupied over the one-year period.
Ho P1 P2 - Select your answer -
Ha P₁ P2 - Select your answer -
b. What is the estimated proportion of hotel rooms occupied each year (to 2 decimals)?
Current Year
Current year
Previous Year
c. Conduct a hypothesis test. What is the p-value (to 4 decimals)? Use Table 1 from Appendix B.
p-value =
Using a 0.05 level of significance, what is your conclusion?
Previous Year
-
We - Select your answer that there…
Chapter 10 Solutions
Pearson eText for Statistical Reasoning for Everyday Life -- Instant Access (Pearson+)
Ch. 10.1 - t Distribution. What is the t distribution? What...Ch. 10.1 - Degrees of Freedom. How do you determine the...Ch. 10.1 - Prob. 3ECh. 10.1 - Hypothesis Test. Briefly summarize the procedure...Ch. 10.1 - Does It Make Sense? For Exercises 58, determine...Ch. 10.1 - Prob. 6ECh. 10.1 - Prob. 7ECh. 10.1 - Prob. 8ECh. 10.1 - Confidence Intervals. In Exercises 918, use the t...Ch. 10.1 - Confidence Intervals. In Exercises 918, use the t...
Ch. 10.1 - Elbow-to-Fingertip Length of Men. A simple random...Ch. 10.1 - Earthquake Epicenter Depths. A simple random...Ch. 10.1 - Hospital Costs with Seat Belts. A study was...Ch. 10.1 - Prob. 14ECh. 10.1 - Estimating Car Pollution. Each car in a sample of...Ch. 10.1 - Movie Lengths. Listed below are lengths (in...Ch. 10.1 - Prob. 17ECh. 10.1 - Prob. 18ECh. 10.1 - Hypothesis Tests. In Exercises 1928, test the...Ch. 10.1 - Prob. 20ECh. 10.1 - Hypothesis Tests. In Exercises 1928, test the...Ch. 10.1 - Prob. 22ECh. 10.1 - Hypothesis Tests. In Exercises 1928, test the...Ch. 10.1 - Hypothesis Tests. In Exercises 1928, test the...Ch. 10.1 - Prob. 25ECh. 10.1 - Prob. 26ECh. 10.1 - Prob. 27ECh. 10.1 - Prob. 28ECh. 10.2 - Two-Way Tables. What is a two-way table? What are...Ch. 10.2 - Hypotheses. When working with two variables in a...Ch. 10.2 - Prob. 3ECh. 10.2 - Prob. 4ECh. 10.2 - Does It Make Sense? For Exercises 58, determine...Ch. 10.2 - Does It Make Sense? For Exercises 58, determine...Ch. 10.2 - Does It Make Sense? For Exercises 58, determine...Ch. 10.2 - Does It Make Sense? For Exercises 58, determine...Ch. 10.2 - Prob. 9ECh. 10.2 - Understanding a Two-Way Table Hypothesis Test....Ch. 10.2 - Survey Results. In Exercises 1114, assume that a...Ch. 10.2 - Survey Results. In Exercises 1114, assume that a...Ch. 10.2 - Survey Results. In Exercises 1114, assume that a...Ch. 10.2 - Survey Results. In Exercises 1114, assume that a...Ch. 10.2 - Prob. 15ECh. 10.2 - Complete Hypothesis Test. In Exercises 1522, carry...Ch. 10.2 - Complete Hypothesis Test. In Exercises 1522, carry...Ch. 10.2 - Complete Hypothesis Test. In Exercises 1522, carry...Ch. 10.2 - Complete Hypothesis Test. In Exercises 1522, carry...Ch. 10.2 - Prob. 20ECh. 10.2 - Prob. 21ECh. 10.2 - Prob. 22ECh. 10.3 - ANOVA. What does ANOVA stand for? What is the...Ch. 10.3 - Prob. 2ECh. 10.3 - Variance in ANOVA. Describe and distinguish...Ch. 10.3 - Test Statistic F. What is the meaning of small and...Ch. 10.3 - Prob. 5ECh. 10.3 - Prob. 6ECh. 10.3 - Does It Make Sense? For Exercises 58, determine...Ch. 10.3 - Does It Make Sense? For Exercises 58, determine...Ch. 10.3 - Prob. 9ECh. 10.3 - Comparing Colleges. A researcher obtains random...Ch. 10.3 - Readability of Authors. Samples of Flesch-Kincaid...Ch. 10.3 - Fabric Flammability Tests in Different...Ch. 10.3 - Prob. 13ECh. 10.3 - Pulse Rates. A random sample of adult females is...Ch. 10.3 - Using Technology. In Exercises 1518, use software...Ch. 10.3 - Using Technology. In Exercises 1518, use software...Ch. 10.3 - Prob. 17ECh. 10.3 - Using Technology. In Exercises 1518, use software...Ch. 10 - In Exercises 13, use the following service times...Ch. 10 - In Exercises 13, use the following service times...Ch. 10 - In Exercises 13, use the following service times...Ch. 10 - Prob. 4CRECh. 10 - Prob. 1CQCh. 10 - As part of the results from the test described in...Ch. 10 - For the hypothesis test described in Exercise 1,...Ch. 10 - A simple random sample of 25 blood platelet counts...Ch. 10 - Prob. 5CQCh. 10 - Prob. 6CQCh. 10 - Prob. 7CQCh. 10 - If the hypothesis test of the claim described in...Ch. 10 - A two-way table, constructed from survey results,...Ch. 10 - Prob. 10CQ
Knowledge Booster


Learn more about
Need a deep-dive on the concept behind this application? Look no further. Learn more about this topic, statistics and related others by exploring similar questions and additional content below.Similar questions
- The table below shows results from a recent General Social Survey on two variables, respondent sex and whether one believes in an afterlife. Compare the proportions of women and men who believe in an afterlife. Question: State the hypotheses, calculate the test statistic, p-value and write your conclusions, using α = 0.05. Belief in Afterlife Sex Yes No or Undecided Total 1. Male 375 134 509 2. Female 435 147 582 Let = 1. be the population proportion of men who believe in an afterlife Let = 2. be the population proportion of women who believe in an afterlifearrow_forwardTourism is extremely important to the economy of Florida. Hotel occupancy is an often-reported measure of visitor volume and visitor activity (Orlando Sentinel, May 19, 2018). Hotel occupancy data for February in two consecutive years are as follows. Occupied Rooms Total Rooms Current Year Let pi population proportion of rooms occupied for current year P = population proportion of rooms occupied for previous year 1,435 1,750 Previous Year a. Formulate the hypothesis test that can be used to determine whether there has been an increase in the proportion of rooms occupied over the one-year period. Ho Pi-Pa-Select your answer- H.: P-P-Select your answer- b. What is the estimated proportion of hotel rooms occupied each year (to 2 decimals)? 1,404 1,800 Current year Previous Year c. Conduct a hypothesis test. What is the p-value (to 4 decimals)? Use Table 1 from Appendix B. p-value- Using a 0.05 level of significance, what is your conclusion? We Select your answer that there has been an…arrow_forwardA researcher selects a sample and administers a treatment for anxiety to the individuals in the sample. If the sample is used for a hypothesis test, what does the alternative hypothesis (H1) put forth about the treatment? A. The treatment has no effect on anxiety. B. The treatment adds a constant to each anxiety score. C. The treatment multiplies each anxiety score by a constant. D. The treatment has an effect on anxiety.arrow_forward
- Nonearrow_forward(c) Calculate the test statistic. d) Decide whether to reject or fail to reject the null hypothesis. Then interpret the decision in the context of the original claim.arrow_forward(c) Calculate the test statistic. d) Decide whether to reject or fail to reject the null hypothesis. Then interpret the decision in the context of the original claim.arrow_forward
- A study compared the achievement scores (on an interval scale from 0 to 20) on an academic test of 10 males and 10 females tested either early in the day or late in the day. The data are in Table 5 below. Do males and females differ in their academic performance depending on whether they write the assessments early or late in the day? Test at an alpha at 0.05 and use all of the steps of hypothesis testing.arrow_forwardA sample is selected from a population with a mean reading score of µ= 50. A new reading strategies treatment is administered to 16 individuals in a sample (n=16). The reading scores after the reading strategies treatment is found to be M = 55 and SS = 960. Was the reading strategies treatment effective? a. Use a two-tailed test with a = .05. Conduct the four steps for hypothesis testing and label each step: Step1, Step 2, Step 3, and Step 4. b. Calculate Cohen’s d. c. Are the data sufficient to conclude that thier is a significant difference? Write your answer in the form of a sentence.arrow_forwardDecide whether to reject or fail to reject the null hypothesis. Choose the correct answer below.arrow_forward
- The proportion of students who get an undergraduate degree in statistics in four years was compared for meals and females. Random sample of 200 male statistics majors and 200 female statistics majors were taken. Choose the appropriate parameter(s) for this situation. [Hint: The parameter(s) to be used in your hypothesis]. O A. H O B. None of these O C. P1-P2 O D. P O E. H1-H2arrow_forwardTest the claim that the proportion of men who own cats is significantly different than 50% at the 0.02 significance level.a.) The null and alternative hypothesis would be: b.) The test is: right-tailed left-tailed two-tailed Based on a sample of 60 men, 59% owned cats c.) The sample proportion ˆp=d.) The test statistic is: (to 2 decimals)e.) At α=α=0.02, the critical value is:± (to 2 decimals)f.) Based on this we: Reject the null hypothesis Fail to reject the null hypothesisarrow_forwardThe following table contains the number of successes and failures for three categories of a variable Test whether the proportions are equal for each category at the a=0.1 level of significance Category 1 Category 2 Category 3 49 43 Failures Successes 33 38 76 48 Click the icon to view the Chi-Square table of critical values State the hypotheses. Choose the correct answer below OA. H. The categories of the vanable and success and failure are dependent H, The categories of the variable and success and falure are independent OB. H. The categories of the variable and success and future are independent H₁ The categones of the vanable and success and failure are dependent OC. Ho PE, and and H, At least one mean is different from what is expected OD. H₂ P₁ P₂ Ps H, At least one of the proportions is different from the othersarrow_forward
arrow_back_ios
SEE MORE QUESTIONS
arrow_forward_ios
Recommended textbooks for you
 Holt Mcdougal Larson Pre-algebra: Student Edition...AlgebraISBN:9780547587776Author:HOLT MCDOUGALPublisher:HOLT MCDOUGAL
 Glencoe Algebra 1, Student Edition, 9780079039897...AlgebraISBN:9780079039897Author:CarterPublisher:McGraw Hill
 Algebra & Trigonometry with Analytic GeometryAlgebraISBN:9781133382119Author:SwokowskiPublisher:Cengage
Holt Mcdougal Larson Pre-algebra: Student Edition...
Algebra
ISBN:9780547587776
Author:HOLT MCDOUGAL
Publisher:HOLT MCDOUGAL
Glencoe Algebra 1, Student Edition, 9780079039897...
Algebra
ISBN:9780079039897
Author:Carter
Publisher:McGraw Hill
Algebra & Trigonometry with Analytic Geometry
Algebra
ISBN:9781133382119
Author:Swokowski
Publisher:Cengage
Hypothesis Testing - Solving Problems With Proportions; Author: The Organic Chemistry Tutor;https://www.youtube.com/watch?v=76VruarGn2Q;License: Standard YouTube License, CC-BY
Hypothesis Testing and Confidence Intervals (FRM Part 1 – Book 2 – Chapter 5); Author: Analystprep;https://www.youtube.com/watch?v=vth3yZIUlGQ;License: Standard YouTube License, CC-BY