STATISTICS FOR ENGR.+SCI-W/ACCESS
4th Edition
ISBN: 9781260036107
Author: Navidi
Publisher: MCG
expand_more
expand_more
format_list_bulleted
Concept explainers
Videos
Textbook Question
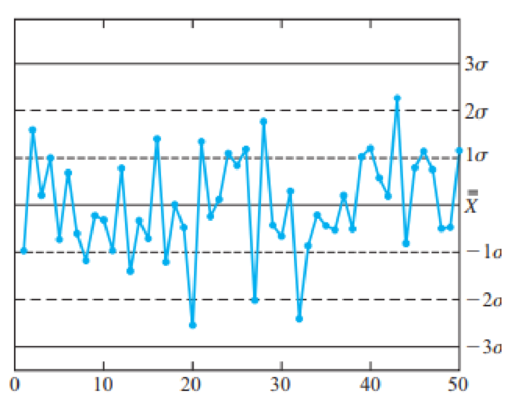
Chapter 10.2, Problem 2E
The following
Expert Solution & Answer
Want to see the full answer?
Check out a sample textbook solution
Students have asked these similar questions
Q1. An anthropologist wants to collect data to determine whether the two different cultural groups that occupy an isolated Pacific Island grow to be different heights. The results of his samples of the heights of adult females are as follows Do these samples constitute enough evidence to reject the null hypothesis that the heights of the two groups the same? Set alpha to .05.
To increase egg production, a farmer decided to increase the number of times the lights in his henhouse were on. Ten hens were randomly selected, and the number of eggs each produced was recorded. After one week of lengthened light time, the same hens were monitored again. The data is given here. At α = 0.05, can it be concluded that the increased light time increased egg production?
Hen
1
2
3
4
5
6
7
8
9
10
Before
4
3
8
7
6
4
9
7
6
5
After
6
5
9
7
4
5
10
6
9
6
An SRS of 100 flights by Speedy Airlines showed that 64 were on time. An SRS of 100 flights by Happy Airlines showed that 80 were on time. Let pS be the proportion of on-time flights for all Speedy Airline flights, and let pH be the proportion of all on-time flights for all Happy Airlines flights. Is there evidence of a difference in the on-time rate for the two airlines? To determine this, you test the hypotheses H0 : pS – pH 0, Ha : pS – pH 0. The P-value of your test is 0.0117. Which of the following is an appropriate interpretation of the P-value? a. If the on-time rates for the two airlines are equal, there is a 0.0117 probability of getting samples with a difference as far or farther from zero as these samples. b. If the on-time rates for the two airlines are not equal, the probability of getting samples with a difference as far or farther from zero as these samples is 0.9883. c. The probability of making a Type I error is 0.0117. d. The probability of making a Type II error…
Chapter 10 Solutions
STATISTICS FOR ENGR.+SCI-W/ACCESS
Ch. 10.1 - Indicate whether each of the following quality...Ch. 10.1 - True or false: a. Control charts are used to...Ch. 10.1 - Prob. 3ECh. 10.1 - Prob. 4ECh. 10.1 - True or false: a. When a process is in a stale of...Ch. 10.1 - Prob. 6ECh. 10.2 - The quality-control plan for a certain production...Ch. 10.2 - The following X chart depicts the last 50 samples...Ch. 10.2 - The thickness, in mm, of metal washers is measured...Ch. 10.2 - Repeat Exercise 3, using the S chart in place of...
Ch. 10.2 - A process has mean 12 and standard deviation 3....Ch. 10.2 - A process has mean 8 and standard deviation 2. The...Ch. 10.2 - A process is monitored by taking samples at...Ch. 10.2 - Prob. 8ECh. 10.2 - Repeat Exercise 8, using the S chart in place of...Ch. 10.2 - Prob. 10ECh. 10.2 - Repeat Exercise 10, using the S chart in place of...Ch. 10.2 - Copper wires are coated with a thin plastic...Ch. 10.2 - Repeat Exercise 12, using the S chart in place of...Ch. 10.3 - Prob. 1ECh. 10.3 - The target fill weight for a box of cereal is 350...Ch. 10.3 - Prob. 3ECh. 10.3 - Refer to Exercise 3. In the last 50 samples, there...Ch. 10.3 - A newly designed quality-control program for a...Ch. 10.3 - Prob. 6ECh. 10.3 - Prob. 7ECh. 10.3 - Each hour, a 10 m2 section of fabric is inspected...Ch. 10.4 - Refer to Exercise 3 in Section 10.2. a. Delete any...Ch. 10.4 - Refer to Exercise 8 in Section 10.2. a. Delete any...Ch. 10.4 - Prob. 3ECh. 10.4 - Refer to Exercise 12 in Section 10.2.ss a. Delete...Ch. 10.4 - Prob. 5ECh. 10.4 - Prob. 6ECh. 10.5 - The thickness specification for aluminum sheets is...Ch. 10.5 - The specification for the diameters of ball...Ch. 10.5 - Refer to Exercise 2. a. To what value should the...Ch. 10.5 - Refer to Exercise 1. a. To what value should the...Ch. 10.5 - A process has a process capability index of Cp =...Ch. 10 - Prob. 1SECh. 10 - Prob. 2SECh. 10 - Prob. 3SECh. 10 - Prob. 4SECh. 10 - Prob. 5SECh. 10 - Prob. 6SECh. 10 - To set up a p chart to monitor a process that...
Additional Math Textbook Solutions
Find more solutions based on key concepts
31. Putting It Together: A Tornado Model Is the width of a tornado related to the amount of distance for which ...
Statistics: Informed Decisions Using Data (5th Edition)
Teacher Salaries
The following data from several years ago represent salaries (in dollars) from a school distri...
Elementary Statistics: A Step By Step Approach
the proportion of red cars in the sample and display the sampling distribution of the sample proportion on dot ...
PRACTICE OF STATISTICS F/AP EXAM
In Exercises 9-20, use the data in the following table, which lists drive-thru order accuracy at popular fast f...
Essentials of Statistics (6th Edition)
In Exercises 5-36, express all probabilities as fractions.
23. Combination Lock The typical combination lock us...
Essentials of Statistics, Books a la Carte Edition (5th Edition)
c
Solve.
70. Copy Center Account. Rachel’s copy-center bill for July was $327. She made a payment of $200 and t...
Developmental Mathematics (9th Edition)
Knowledge Booster


Learn more about
Need a deep-dive on the concept behind this application? Look no further. Learn more about this topic, statistics and related others by exploring similar questions and additional content below.Similar questions
- Can you provide any explanation for these results? For THE 3 TABS BELOW: Tab 1, Tab 2 & Tab 3 TAB 1. Year Age of Miss America Murder by steam, hot vapors and hot objects Dev(x) Dev(y) CP 1999 24 7 1.9 2.5 4.69 2000 24 7 1.9 2.5 4.69 2001 24 7 1.9 2.5 4.69 2002 21 3 -1.1 -1.5 1.69 2003 22 4 -0.1 -0.5 0.05 2004 21 3 -1.1 -1.5 1.69 2005 24 8 1.9 3.5 6.60 2006 22 4 -0.1 -0.5 0.05 2007 20 2 -2.1 -2.5 5.32 2008 19 3 -3.1 -1.5 4.78 2009 22 2 -0.1 -2.5 0.23 Mean 22.1 5 Sum 34.45 Standard Deviation 1.75810 2.25227 Covariance 3.45 Correlation Coefficient 0.87013 0.87013 TAB 2 Year Letter in Winning World of Scripps National Spelling Bee Number of people Killed by venomous spider Dev(x) Dev(y) CP 1999 9 6 -1.0 -1.4 1.36 2000 8 5…arrow_forwardA test of H0H0:μ=1:μ=1 against HaHa:μ>1:μ>1 has test statistic zz = 1.74. Answer "Yes/Y" or "No/N" to the following questions. Is this test significant at the 2.5% level (αα = 0.025)? Is it significant at the 0.5% level (αα = 0.005)?arrow_forwardA sample of n= 64 scores has a mean of M= 68. Assuming that the population mean is u=60, find the z-score for this sample: If it was obtained from a population with o= 16 Z=arrow_forward
- The management of the local zoo wants to know if all of their animal exhibits are equally popular. If there is significant evidence that some of the exhibits are not being visited frequently enough, then changes may need to take place within the zoo. A tally of visitors is taken for each of the following animals throughout the course of a week, and the results are contained in the following table. At α=0.005, determine whether there is sufficient evidence to conclude that some exhibits are less popular than others. Animal Exhibits at the Zoo Elephants Lions/Tigers Giraffes Zebras Monkeys Birds ReptilesNumber of visitors 152 175 185 144 145 171 163 Step 2 of 4 : Calculate the expected value for the number of visitors for the birds exhibit. Enter your answer as a fraction or a decimal rounded to three decimal places. Step 3 of 4: Compute the value of the test statistic. Round any calculations to at least six decimals places and round your final answer to three…arrow_forwardGiven that n=82 data points are collected when studying the relationship between average daily temperature and time spent watching television, use the critical values table below to determine if a calculated value of r=−0.974 is significant or not. df CV (+ and -) df CV (+ and -) df CV (+ and -) df CV (+ and -) 1 0.997 11 0.555 21 0.413 40 0.304 2 0.950 12 0.532 22 0.404 50 0.273 3 0.878 13 0.514 23 0.396 60 0.250 4 0.811 14 0.497 24 0.388 70 0.232 5 0.754 15 0.482 25 0.381 80 0.217 6 0.707 16 0.468 26 0.374 90 0.205 7 0.666 17 0.456 27 0.367 100 0.195 8 0.632 18 0.444 28 0.361 9 0.602 19 0.433 29 0.355 10 0.576 20 0.423 30 0.349 Select the correct answer below: r is significant because it is between the positive and negative critical values. r is not significant because it is between the positive and negative critical values. r is significant because it is not between the positive and negative critical values. r is not…arrow_forwardLet X1, . . . , Xn ∼ iid Unif(θ1, θ2), where both θ1 and θ2 are unknown. Find the MOM estimator and compare them to the MLE.arrow_forward
- T/F: An analysis was performed on data relating the number of weeks of experience in a job involving the wiring of electronic components and the number of components that were rejected during the past week for 12 randomly selected workers. The analysis is as follows: There is no apparent relationship between experience and rejects produced. True Falsearrow_forwardConsider the following data. Do heavier cars really use more gasoline? Suppose a car is chosen at random. Let x be the weight of the car (in hundreds of pounds), and let y be the miles per gallon (mpg). The following information is based on data taken from Consumer Reports (Vol. 62, No. 4).arrow_forwardA poll found that 15% of adults do not work at all while on summer vacation. In a random sample of 8 adults, let x represent the number who do not work during summer vacation. Complete parts a through e.arrow_forward
arrow_back_ios
SEE MORE QUESTIONS
arrow_forward_ios
Recommended textbooks for you
 MATLAB: An Introduction with ApplicationsStatisticsISBN:9781119256830Author:Amos GilatPublisher:John Wiley & Sons Inc
 Probability and Statistics for Engineering and th...StatisticsISBN:9781305251809Author:Jay L. DevorePublisher:Cengage Learning
 Statistics for The Behavioral Sciences (MindTap C...StatisticsISBN:9781305504912Author:Frederick J Gravetter, Larry B. WallnauPublisher:Cengage Learning
 Elementary Statistics: Picturing the World (7th E...StatisticsISBN:9780134683416Author:Ron Larson, Betsy FarberPublisher:PEARSON
 The Basic Practice of StatisticsStatisticsISBN:9781319042578Author:David S. Moore, William I. Notz, Michael A. FlignerPublisher:W. H. Freeman
 Introduction to the Practice of StatisticsStatisticsISBN:9781319013387Author:David S. Moore, George P. McCabe, Bruce A. CraigPublisher:W. H. Freeman
MATLAB: An Introduction with Applications
Statistics
ISBN:9781119256830
Author:Amos Gilat
Publisher:John Wiley & Sons Inc
Probability and Statistics for Engineering and th...
Statistics
ISBN:9781305251809
Author:Jay L. Devore
Publisher:Cengage Learning
Statistics for The Behavioral Sciences (MindTap C...
Statistics
ISBN:9781305504912
Author:Frederick J Gravetter, Larry B. Wallnau
Publisher:Cengage Learning
Elementary Statistics: Picturing the World (7th E...
Statistics
ISBN:9780134683416
Author:Ron Larson, Betsy Farber
Publisher:PEARSON
The Basic Practice of Statistics
Statistics
ISBN:9781319042578
Author:David S. Moore, William I. Notz, Michael A. Fligner
Publisher:W. H. Freeman
Introduction to the Practice of Statistics
Statistics
ISBN:9781319013387
Author:David S. Moore, George P. McCabe, Bruce A. Craig
Publisher:W. H. Freeman
Sampling Methods and Bias with Surveys: Crash Course Statistics #10; Author: CrashCourse;https://www.youtube.com/watch?v=Rf-fIpB4D50;License: Standard YouTube License, CC-BY
Statistics: Sampling Methods; Author: Mathispower4u;https://www.youtube.com/watch?v=s6ApdTvgvOs;License: Standard YouTube License, CC-BY