
ALEKS 360 BLUMAN ELE.STAT:A STEP.(11WKS)
10th Edition
ISBN: 9781260041842
Author: Bluman
Publisher: MCG CUSTOM
expand_more
expand_more
format_list_bulleted
Concept explainers
Videos
Textbook Question
Chapter 10.2, Problem 34E
For Exercises 34 and 35, do a complete
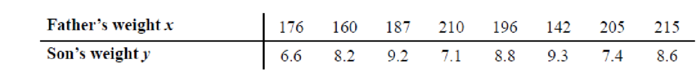
34. Father’s and Son’s Weights A physician wishes to know whether there is a relationship between a father’s weight (in pounds) and his newborn son’s weight (in pounds). The data are given here.
Expert Solution & Answer
Want to see the full answer?
Check out a sample textbook solution
Chapter 10 Solutions
ALEKS 360 BLUMAN ELE.STAT:A STEP.(11WKS)
Ch. 10.1 - Stopping Distances In a study on speed control, it...Ch. 10.1 - What is meant by the statement that two variables...Ch. 10.1 - How is a linear relationship between two variables...Ch. 10.1 - What is the symbol for the sample correlation...Ch. 10.1 - What is the range of values for the correlation...Ch. 10.1 - What is meant when the relationship between the...Ch. 10.1 - Give examples of two variables that are positively...Ch. 10.1 - What is the diagram of the independent and...Ch. 10.1 - What is the name of the correlation coefficient...Ch. 10.1 - What statistical test is used to test the...
Ch. 10.1 - When two variables are correlated, can the...Ch. 10.1 - For Exercises 11 through 27, perform the following...Ch. 10.1 - For Exercises 11 through 27, perform the following...Ch. 10.1 - For Exercises 11 through 27, perform the following...Ch. 10.1 - For Exercises 11 through 27, perform the following...Ch. 10.1 - For Exercises 11 through 27, perform the following...Ch. 10.1 - For Exercises 11 through 27, perform the following...Ch. 10.1 - For Exercises 11 through 27, perform the following...Ch. 10.1 - For Exercises 11 through 27, perform the following...Ch. 10.1 - For Exercises 11 through 27, perform the following...Ch. 10.1 - For Exercises 11 through 27, perform the following...Ch. 10.1 - For Exercises 11 through 27, perform the following...Ch. 10.1 - For Exercises 11 through 27, perform the following...Ch. 10.1 - Prob. 23ECh. 10.1 - For Exercises 11 through 27, perform the following...Ch. 10.1 - For Exercises 11 through 27, perform the following...Ch. 10.1 - For Exercises 11 through 27, perform the following...Ch. 10.1 - Prob. 27ECh. 10.1 - Prob. 28ECCh. 10.1 - Prob. 29ECCh. 10.1 - Prob. 30ECCh. 10.2 - Applying the Concepts 102 Stopping Distances...Ch. 10.2 - What two things should be done before one performs...Ch. 10.2 - What are the assumptions for regression analysis?Ch. 10.2 - Prob. 3ECh. 10.2 - What is the symbol for the slope? For the y...Ch. 10.2 - Prob. 5ECh. 10.2 - When all the points fall on the regression line,...Ch. 10.2 - What is the relationship between the sign of the...Ch. 10.2 - As the value of the correlation coefficient...Ch. 10.2 - Prob. 9ECh. 10.2 - When the value of r is not significant, what value...Ch. 10.2 - For Exercises 11 through 27, use the same data as...Ch. 10.2 - Prob. 12ECh. 10.2 - For Exercises 11 through 27, use the same data as...Ch. 10.2 - For Exercises 11 through 27, use the same data as...Ch. 10.2 - For Exercises 11 through 27, use the same data as...Ch. 10.2 - For Exercises 11 through 27, use the same data as...Ch. 10.2 - Prob. 17ECh. 10.2 - For Exercises 11 through 27, use the same data as...Ch. 10.2 - For Exercises 11 through 27, use the same data as...Ch. 10.2 - For Exercises 11 through 27, use the same data as...Ch. 10.2 - For Exercises 11 through 27, use the same data as...Ch. 10.2 - For Exercises 11 through 27, use the same data as...Ch. 10.2 - For Exercises 11 through 27, use the same data as...Ch. 10.2 - For Exercises 11 through 27, use the same data as...Ch. 10.2 - Prob. 25ECh. 10.2 - Prob. 26ECh. 10.2 - For Exercises 11 through 27, use the same data as...Ch. 10.2 - For Exercises 28 through 33, do a complete...Ch. 10.2 - Prob. 29ECh. 10.2 - For Exercises 28 through 33, do a complete...Ch. 10.2 - For Exercises 28 through 33, do a complete...Ch. 10.2 - For Exercises 28 through 33, do a complete...Ch. 10.2 - Prob. 33ECh. 10.2 - For Exercises 34 and 35, do a complete regression...Ch. 10.2 - For Exercises 34 and 35, do a complete regression...Ch. 10.2 - For Exercises 13, 15, and 21 in Section 101, find...Ch. 10.2 - The y intercept value a can also be found by using...Ch. 10.2 - The value of the correlation coefficient can also...Ch. 10.3 - Applying the Concepts 103 Interpreting Simple...Ch. 10.3 - What is meant by the explained variation? How is...Ch. 10.3 - What is meant by the unexplained variation? How is...Ch. 10.3 - What is meant by the total variation? How is it...Ch. 10.3 - Define the coefficient of determination.Ch. 10.3 - How is the coefficient of determination found?Ch. 10.3 - Define the coefficient of nondetermination.Ch. 10.3 - How is the coefficient of nondetermination found?Ch. 10.3 - Prob. 8ECh. 10.3 - Prob. 9ECh. 10.3 - Prob. 10ECh. 10.3 - Prob. 11ECh. 10.3 - Prob. 12ECh. 10.3 - Prob. 13ECh. 10.3 - Prob. 14ECh. 10.3 - Prob. 15ECh. 10.3 - Compute the standard error of the estimate for...Ch. 10.3 - Compute the standard error of the estimate for...Ch. 10.3 - Compute the standard error of the estimate for...Ch. 10.3 - Prob. 19ECh. 10.3 - For the data in Exercises 14 in Sections 101 and...Ch. 10.3 - Prob. 21ECh. 10.3 - Prob. 22ECh. 10.4 - Applying the Concepts 104 More Math Means More...Ch. 10.4 - Explain the similarities and differences between...Ch. 10.4 - What is the general form of the multiple...Ch. 10.4 - Prob. 3ECh. 10.4 - Prob. 4ECh. 10.4 - How do the values of the individual correlation...Ch. 10.4 - Age, GPA, and Income A researcher has determined...Ch. 10.4 - Nursing Home Satisfaction A researcher found that...Ch. 10.4 - Special Occasion Cakes A pastry chef who...Ch. 10.4 - Aspects of Students Academic Behavior A college...Ch. 10.4 - Age, Cholesterol, and Sodium A medical researcher...Ch. 10.4 - Explain the meaning of the multiple correlation...Ch. 10.4 - What is the range of values R can assume?Ch. 10.4 - Prob. 13ECh. 10.4 - What are the hypotheses used to test the...Ch. 10.4 - What test is used to test the significance of R?Ch. 10.4 - What is the meaning of the adjusted R2? Why is it...Ch. 10 - For Exercises 1 through 7, do a complete...Ch. 10 - For Exercises 1 through 7, do a complete...Ch. 10 - For Exercises 1 through 7, do a complete...Ch. 10 - For Exercises 1 through 7, do a complete...Ch. 10 - For Exercises 1 through 7, do a complete...Ch. 10 - For Exercises 1 through 7, do a complete...Ch. 10 - For Exercises 1 through 7, do a complete...Ch. 10 - For Exercise 4, find the standard error of the...Ch. 10 - Prob. 10.3.9RECh. 10 - Prob. 10.3.10RECh. 10 - Prob. 10.3.11RECh. 10 - Prob. 10.3.12RECh. 10 - (Opt.) A study found a significant relationship...Ch. 10 - Prob. 10.4.14RECh. 10 - Prob. 10.4.15RECh. 10 - Prob. 1CQCh. 10 - Determine whether each statement is true or false....Ch. 10 - Determine whether each statement is true or false....Ch. 10 - Determine whether each statement is true or false....Ch. 10 - Determine whether each statement is true or false....Ch. 10 - Determine whether each statement is true or false....Ch. 10 - Prob. 7CQCh. 10 - Select the best answer. 8. To test the...Ch. 10 - Select the best answer. 9. The test of...Ch. 10 - Prob. 10CQCh. 10 - Prob. 11CQCh. 10 - Prob. 12CQCh. 10 - Complete the following statements with the best...Ch. 10 - Prob. 14CQCh. 10 - Prob. 15CQCh. 10 - Prob. 16CQCh. 10 - Prob. 17CQCh. 10 - Prob. 18CQCh. 10 - Prob. 19CQCh. 10 - Prob. 20CQCh. 10 - Prob. 21CQCh. 10 - Prob. 22CQCh. 10 - Prob. 23CQCh. 10 - For Exercise 20, find the 90% prediction interval...Ch. 10 - Prob. 25CQCh. 10 - Prob. 26CQCh. 10 - (Opt.) Find R when ryx1 = 0.561 and ryx2 = 0.714...Ch. 10 - Prob. 28CQCh. 10 - Prob. 1CTCCh. 10 - Prob. 2CTCCh. 10 - Prob. 3CTCCh. 10 - Prob. 4CTCCh. 10 - Product Sales When the points in a scatter plot...Ch. 10 - Prob. 6CTCCh. 10 - Prob. 7CTCCh. 10 - Product Sales When the points in a scatter plot...Ch. 10 - Prob. 9CTC
Knowledge Booster


Learn more about
Need a deep-dive on the concept behind this application? Look no further. Learn more about this topic, statistics and related others by exploring similar questions and additional content below.Similar questions
- Life Expectancy The following table shows the average life expectancy, in years, of a child born in the given year42 Life expectancy 2005 77.6 2007 78.1 2009 78.5 2011 78.7 2013 78.8 a. Find the equation of the regression line, and explain the meaning of its slope. b. Plot the data points and the regression line. c. Explain in practical terms the meaning of the slope of the regression line. d. Based on the trend of the regression line, what do you predict as the life expectancy of a child born in 2019? e. Based on the trend of the regression line, what do you predict as the life expectancy of a child born in 1580?2300arrow_forwardFind the equation of the regression line for the following data set. x 1 2 3 y 0 3 4arrow_forwardXYZ Corporation Stock Prices The following table shows the average stock price, in dollars, of XYZ Corporation in the given month. Month Stock price January 2011 43.71 February 2011 44.22 March 2011 44.44 April 2011 45.17 May 2011 45.97 a. Find the equation of the regression line. Round the regression coefficients to three decimal places. b. Plot the data points and the regression line. c. Explain in practical terms the meaning of the slope of the regression line. d. Based on the trend of the regression line, what do you predict the stock price to be in January 2012? January 2013?arrow_forward
- For the following exercises, consider the data in Table 5, which shows the percent of unemployed in a city ofpeople25 years or older who are college graduates is given below, by year. 41. Based on the set of data given in Table 7, calculatethe regression line using a calculator or othertechnology tool, and determine the correlationcoefficient to three decimal places.arrow_forwardFor the following exercises, consider the data in Table 5, which shows the percent of unemployed ina city of people 25 years or older who are college graduates is given below, by year. 40. Based on the set of data given in Table 6, calculate the regression line using a calculator or other technology tool, and determine the correlation coefficient to three decimal places.arrow_forward
arrow_back_ios
arrow_forward_ios
Recommended textbooks for you
 Glencoe Algebra 1, Student Edition, 9780079039897...AlgebraISBN:9780079039897Author:CarterPublisher:McGraw Hill
 Algebra & Trigonometry with Analytic GeometryAlgebraISBN:9781133382119Author:SwokowskiPublisher:Cengage
 Functions and Change: A Modeling Approach to Coll...AlgebraISBN:9781337111348Author:Bruce Crauder, Benny Evans, Alan NoellPublisher:Cengage Learning
 Trigonometry (MindTap Course List)TrigonometryISBN:9781337278461Author:Ron LarsonPublisher:Cengage Learning
Glencoe Algebra 1, Student Edition, 9780079039897...
Algebra
ISBN:9780079039897
Author:Carter
Publisher:McGraw Hill
Algebra & Trigonometry with Analytic Geometry
Algebra
ISBN:9781133382119
Author:Swokowski
Publisher:Cengage
Functions and Change: A Modeling Approach to Coll...
Algebra
ISBN:9781337111348
Author:Bruce Crauder, Benny Evans, Alan Noell
Publisher:Cengage Learning
Trigonometry (MindTap Course List)
Trigonometry
ISBN:9781337278461
Author:Ron Larson
Publisher:Cengage Learning
Correlation Vs Regression: Difference Between them with definition & Comparison Chart; Author: Key Differences;https://www.youtube.com/watch?v=Ou2QGSJVd0U;License: Standard YouTube License, CC-BY
Correlation and Regression: Concepts with Illustrative examples; Author: LEARN & APPLY : Lean and Six Sigma;https://www.youtube.com/watch?v=xTpHD5WLuoA;License: Standard YouTube License, CC-BY