
a. To state:
The null and alternative hypothesis.
Answer to Problem 18E
Solution:
The null hypothesis is
Explanation of Solution
Consider the following scenario,
“Teachers’ salaries in one state are very low, so low that educators in that state regularly complain about their compensation. The state mean is $33, 600, but teachers in one district claim that the mean in their district is significantly lower. They survey a simple random sample of 22 teachers in the district and calculate a mean salary of $32, 400 with a standard deviation of $1520”.
State the null and alternative hypothesis.
Suppose teachers claims that mean in their district is significantly lower than state mean of $33, 600. That is the research hypothesis mathematically as
The Null hypothesis:
The alternative hypothesis:
Final statement:
The null hypothesis is
b. To determine:
Which distribution to use for the test statistic, and state the level of significance.
Answer to Problem 18E
Solution:
The t-test statistic is used and the level of significance of
Explanation of Solution
The t-test statistic is appropriate to use in this case because the claim is about a population mean, the populations
So, t-test statistic is used and the level of significance of
Final statement:
The t-test statistic is used and the level of significance of
c. To gather:
The data and calculate the necessary sample statistics.
Answer to Problem 18E
Solution:
The calculated test statistic is -3.7030.
Explanation of Solution
The test statistic formula:
Test statistic for a hypothesis test for a population mean (
When the population standard deviation is unknown, the sample taken is a simple random sample, and either the
Where n is the sample size,
The given information is,
Substitute these values in the test statistic formula to get the following,
So, the calculated test statistic is -3.7030.
Final statement:
The calculated test statistic is -3.7030.
d. To draw:
To Draw a conclusion and interpret the decision.
Answer to Problem 18E
Solution:
There is a significance evidence to support the teachers’ claims that the mean in their district is significantly lower at the 0.01 level of significance.
Explanation of Solution
Assume that the population standard deviation is unknown and the population distribution is approximately normal.
Rejection Region for Hypothesis Tests for Population Means (
If p-value
If p- value
Degrees of Freedom for t in a Hypothesis Test for a Population Means (
In a hypothesis test for a population mean where the population standard deviation is unknown, the number of degrees of freedom for the Student’s t- distribution of the test statistic is given by
Where n is the sample size.
Form the given information this is the left-tailed test since
From the given information n = 22 then the degrees of freedom is given below,
Conclusion:
Consider the level of significance of
Use the “p value of t-test statistic” calculator to get the following,
The p -value is approximately 0.0007. Since
The diagrammatic representation is given below,
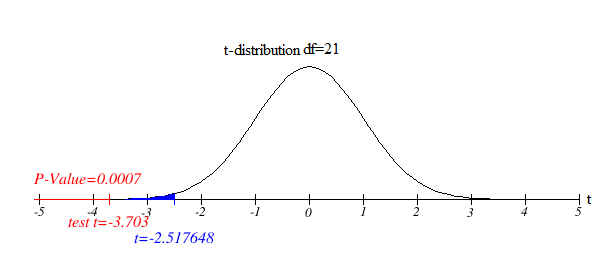
Thus the conclusion is to reject the null hypothesis.
So, there is significance evidence to support the teachers’ claims that the mean in their district is significantly lower at the 0.01 level of significance.
Final statement:
There is a significance evidence to support the teachers’ claims that the mean in their district is significantly lower at the 0.01 level of significance.
Want to see more full solutions like this?
Chapter 10 Solutions
BEGINNING STATISTICS-CD (NEW ONLY)

 MATLAB: An Introduction with ApplicationsStatisticsISBN:9781119256830Author:Amos GilatPublisher:John Wiley & Sons Inc
 Probability and Statistics for Engineering and th...StatisticsISBN:9781305251809Author:Jay L. DevorePublisher:Cengage Learning
 Statistics for The Behavioral Sciences (MindTap C...StatisticsISBN:9781305504912Author:Frederick J Gravetter, Larry B. WallnauPublisher:Cengage Learning
 Elementary Statistics: Picturing the World (7th E...StatisticsISBN:9780134683416Author:Ron Larson, Betsy FarberPublisher:PEARSON
 The Basic Practice of StatisticsStatisticsISBN:9781319042578Author:David S. Moore, William I. Notz, Michael A. FlignerPublisher:W. H. Freeman
 Introduction to the Practice of StatisticsStatisticsISBN:9781319013387Author:David S. Moore, George P. McCabe, Bruce A. CraigPublisher:W. H. Freeman