
Videos
(a)
Find the level of significance.
State the null and alternative hypothesis.
(a)
Answer to Problem 3P
The level of significance is 0.05.
Null hypothesis:
Alternative hypothesis:
Explanation of Solution
Calculation:
Let
From the given information the value of
Hence, the level of significance is 0.05.
The null and alternative hypothesis is,
Null hypothesis:
That is, the variance in the new section is equal to 42.3.
Alternative hypothesis:
That is, the variance in the new section is greater than 42.3.
(b)
Find the value of the chi-square statistic for the sample.
Find the degrees of freedom.
Mention the assumptions made about the original distribution.
(b)
Answer to Problem 3P
The value of the chi-square statistic for the sample is 23.98.
The degrees of freedom are 22.
Explanation of Solution
Calculation:
Test statistic:
The sample chi-square test statistic is,
In the formula
From the given information, a random sample of 23 transects gave a sample variance
Substitute 23 for n, 46.1 for
Hence, the value of the chi-square statistic for the sample is 23.98.
Substitute 23 for n in the degrees of freedom formula.
Hence, the degrees of freedom are 22.
The assumption made about the original distribution is assuming a normal population distribution.
(c)
Find the P-value of the sample test statistic.
(c)
Answer to Problem 3P
The P-value is 0.3483.
Explanation of Solution
Calculation:
Step by step procedure to obtain P-value using MINITAB software is given below:
- Choose Graph > Probability Distribution Plot choose View Probability > OK.
- From Distribution, choose ‘Chi-Square’ distribution.
- In Degrees of freedom, enter the value as 22.
- Click the Shaded Area tab.
- Choose X Value and Right Tail, for the region of the curve to shade.
- Enter the X value as 23.98.
- Click OK.
Output using MINITAB software is given below:
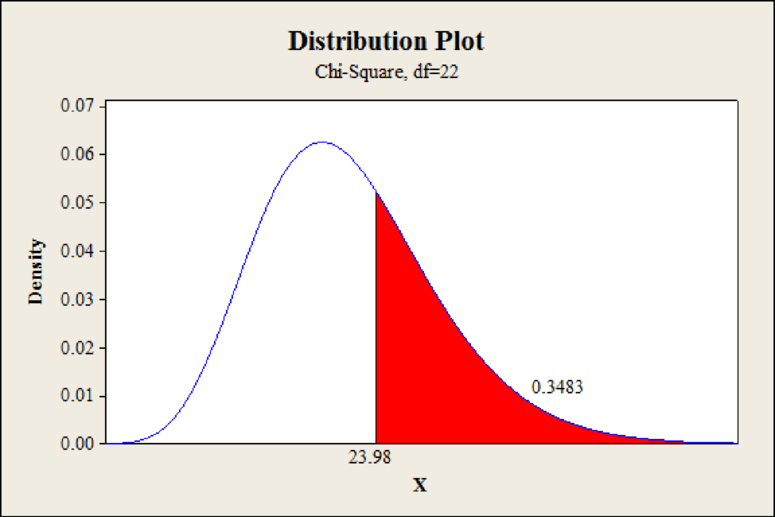
From Minitab output, the P-value is 0.3483.
Hence, the P-value is 0.3483.
(d)
Check whether the null hypothesis of independence is rejected or fail to reject.
(d)
Answer to Problem 3P
The null hypothesis of independence is not rejected.
Explanation of Solution
Calculation:
From part (c), the P-value is 0.3483.
Rejection rule:
- If the P-value is less than or equal to
Conclusion:
The P-value is 0.3483 and the level of significance is 0.05.
The P-value is greater than the level of significance.
That is,
By the rejection rule, the null hypothesis is not rejected.
Hence, the null hypothesis of independence is not rejected.
(e)
Interpret the conclusion in the context of the application.
(e)
Explanation of Solution
Calculation:
From part (d), the null hypothesis is not rejected. This shows that, there is no sufficient evidence that the variance in the new section is greater than 42.3 at level of significance 0.05.
(f)
Find the 95% confidence interval for the population variance.
Interpret the confidence interval.
(f)
Answer to Problem 3P
The 95% confidence interval for the population variance is
Explanation of Solution
Calculation:
Confidence interval:
The confidence interval for the population variance
In the formula c is confidence level,
Critical value for
The right-tail area is,
Use the Appendix II: Tables, Table 7: The
- In d.f. column locate the value 22.
- In Right-tail Area row of locate the value 0.025.
- The intersecting value of row and columns is 36.78.
The value of
Critical value for
The right-tail area is,
Use the Appendix II: Tables, Table 7: The
- In d.f. column locate the value 22.
- In Right-tail Area row of locate the value 0.975.
- The intersecting value of row and columns is 10.98.
The value of
Substitute 23 for n, 46.1 for
Hence, the 95% confidence interval for the population variance is
The confidence interval can be interpreted as; there is 95% confidence that the population variance in the new section lies within the interval 27.57 to 92.37.
Want to see more full solutions like this?
Chapter 10 Solutions
WebAssign Printed Access Card for Brase/Brase's Understandable Statistics: Concepts and Methods, 12th Edition, Single-Term


- Questions 6–10 refer to the sample data in the following table, which describes the fate of the passengers and crew aboard the Titanic when it sank on April 15, 1912. Assume that the data are a sample from a large population and we want to use a 0.05 significance level to test the claim that surviving is independent of whether the person is a man, woman, boy, or girl. Identify the null and alternative hypotheses corresponding to the stated claim.arrow_forwardAnswer the Following Questions for no. 1 and show your clear solutions: A. Getting statistic from a parameter of 800, sampling error of 1% and largest possible proportion of 50%. What is the sample size? B. What is the target sample size for a population of 4,500 people with a standard value of 1.75 and a sampling error of 15%?arrow_forwardPlease answer the following Questions. Part 1.1. A statistical test measures the experimental strength of evidence against the ____ hypothesis. Part 1.2. Type I error is when you end up rejecting the null hypothesis as a result of the statistical testing, when in fact the null hypothesis is actually ____."arrow_forward
- For the following pairs of assertions, indicate which do not comply with our rules for setting up hypotheses and why (the subscripts 1 and 2 differentiate between quantities for two different populations or samples):arrow_forwardIf your question is that your significant hypothesis test is significant “enough” to have true meaning, what are some other things you can look at to determine practical significance?arrow_forwardFor problem 1, perform the hypothesis test. 1) Bob grows pumpkins. He claims that the average weight of his pumpkins is greater than 5.6 lbs. Test his claim if a simple random sample was collected when: the mean of the x scores = 5.9, standard deviation = .3 lb, and the sample size = 81.arrow_forward
- Need answers for these questions . Using the Chi-square statistical tablearrow_forwardFor each of the following situations, state whether you would use a chi-square goodness-of-fit test, a chi-square test of homogeneity, a chi-square test of independence, or some other statistical test. Complete parts a) through c) below. a) Is the quality of a car affected by what day it was built? A car manufacturer examines a random sample of the warranty claims filed over the past two years to test whether defects are randomly distributed across days of the work week. Choose the correct answer below. A. Chi-square test of independence. You have data on two variables, day and quality, for one manufacturer. B. Chi-square goodness-of-fit test. You want to see if the distribution of defects is uniform over the variable day. C. Chi-square test of homogeneity. You have two samples and one variable, day. You want to see if the distribution of quality is the same in the two years. D. Some other statistical test. The variable day is…arrow_forwardWe want to compare cholesterol levels between men and women, so we collect a sample of 20 women and 30 men. The group of men in our sample have a mean of 240.0 with standard deviation 35.0, and the women have a mean of 210.0 with standard deviation 30.0. What is the null hypothesis? Note that two-sample problems (like this one) were not discussed in class, but you should know the answer (or at least be able to provide a good guess below) based on what was covered in class. Group of answer choices The mean cholesterol level in men is equal to the mean cholesterol level in women The mean cholesterol level in men is different than the mean cholesterol level in women The mean cholesterol level in men is less than the mean cholesterol level in women The mean cholesterol level in men is less than the mean cholesterol level in womenarrow_forward
- A manufacturer of chocolate chips would like to know whether its bag filling machine works correctly at the 428 gram setting. It is believed that the machine is underfilling or overfilling the bags. A 46 bag sample had a mean of 433 grams. Assume the population variance is known to be 441. Is there sufficient evidence at the 0.01 level that the bags are underfilled or overfilled? Step 1 of 6: State the null and alternative hypotheses. Step 2 of 6: Find the value of the test statistic. Round your answer to two decimal places. Step 3 of 6: Specify if the test is one-tailed or two-tailed. Step 4 of 6: Find the P-value of the test statistic. Round your answer to four decimal places. Step 5 of 6: Identify the level of significance for the hypothesis test. Step 6 of 6: Make the decision to reject or fail to reject the null hypothesis. Step 7 of 7: State the conclusion of the hypothesis test.arrow_forwardThe closer the numerator of a t-test gets to zero, the more likely it is that there is no statistically significant difference between the two means we are testing. True Falsearrow_forward3)If we have a sample of size 100 with sample mean breaking strength of 975 pounds from a population of rope with standard deviation 200 pounds and we wish to run a hypothesis test with this data to see if the population mean breaking strength differs from 1000 pounds, what is the significance of our data? NONE OF THE OTHERS 2P(Z<-1.25) P(Z<-1.25) 2P(Z>-1.25) P(Z>-1.25)arrow_forward
 MATLAB: An Introduction with ApplicationsStatisticsISBN:9781119256830Author:Amos GilatPublisher:John Wiley & Sons Inc
 Probability and Statistics for Engineering and th...StatisticsISBN:9781305251809Author:Jay L. DevorePublisher:Cengage Learning
 Statistics for The Behavioral Sciences (MindTap C...StatisticsISBN:9781305504912Author:Frederick J Gravetter, Larry B. WallnauPublisher:Cengage Learning
 Elementary Statistics: Picturing the World (7th E...StatisticsISBN:9780134683416Author:Ron Larson, Betsy FarberPublisher:PEARSON
 The Basic Practice of StatisticsStatisticsISBN:9781319042578Author:David S. Moore, William I. Notz, Michael A. FlignerPublisher:W. H. Freeman
 Introduction to the Practice of StatisticsStatisticsISBN:9781319013387Author:David S. Moore, George P. McCabe, Bruce A. CraigPublisher:W. H. Freeman