
Concept explainers
Videos
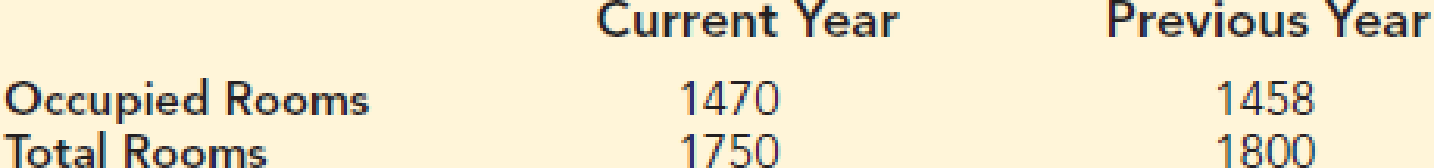
Hotel Occupancy Rates. Tourism is extremely important to the economy of Florida. Hotel occupancy is an often-reported measure of visitor volume and visitor activity (Orlando Sentinel, https://www.orlandosentinel.com/business/tourism/os-bz-hotel-occupancy-dip-20180522-story.html). Hotel occupancy data for February in two consecutive years are as follows.
- a. Formulate the hypothesis test that can be used to determine if there has been an increase in the proportion of rooms occupied over the one-year period.
- b. What is the estimated proportion of hotel rooms occupied each year?
- c. Using a .05 level of significance, what is your hypothesis test conclusion? What is the p-value?
- d. What is the 95% confidence
interval estimate of the change in occupancy for the one-year period? Do you think area officials would be pleased with the results?
a.
State the null and alternative hypotheses.
Answer to Problem 35E
Null hypothesis:
Alternative hypothesis:
Explanation of Solution
Calculation:
The data about the hotel room occupancy in the month of February in two consecutive years is as follows:
| Current year | Previous year | |
| Occupied Rooms | 1,470 | 1,458 |
| Total Rooms | 1,750 | 1,800 |
Here,
State the hypothesis:
Null hypothesis:
That is, the proportion of rooms occupied in the current year is less than or equal to the proportion of rooms occupied in the previous year.
Alternative hypothesis:
That is, the proportion of rooms occupied in the current year is greater than the proportion of rooms occupied in the previous year.
b.
Find the estimated proportion of hotel rooms occupied in each year.
Answer to Problem 35E
The estimated proportion of hotel rooms occupied in the current year is 0.84.
The estimated proportion of hotel rooms occupied in the previous year is 0.81.
Explanation of Solution
Calculation:
For the current year:
The estimated proportion of hotel rooms occupied in the current year is as follows:
Thus, the estimated proportion of hotel rooms occupied in the current year is 0.84.
For the previous year:
The estimated proportion of hotel rooms occupied in the previous year is as follows:
Thus, the estimated proportion of hotel rooms occupied in the previous year is 0.81.
c.
Find the p-value and provide a conclusion at
Answer to Problem 35E
The p-value is 0.009.
There is sufficient evidence to conclude that the proportion of rooms occupied in the current year is greater than the previous year.
Explanation of Solution
Calculation:
The test statistic for hypothesis tests about
Where
Pooled estimator:
Substitute
Thus, the test statistic z-value is 2.35.
Software Procedure:
Step-by-step procedure to obtain the probability value using Excel:
- Open an EXCEL sheet and select the cell A1.
- Enter the formula =NORM.S.DIST(2.35,TRUE) in the cell A1.
- Press Enter.
Output obtained using EXCEL software is given below:
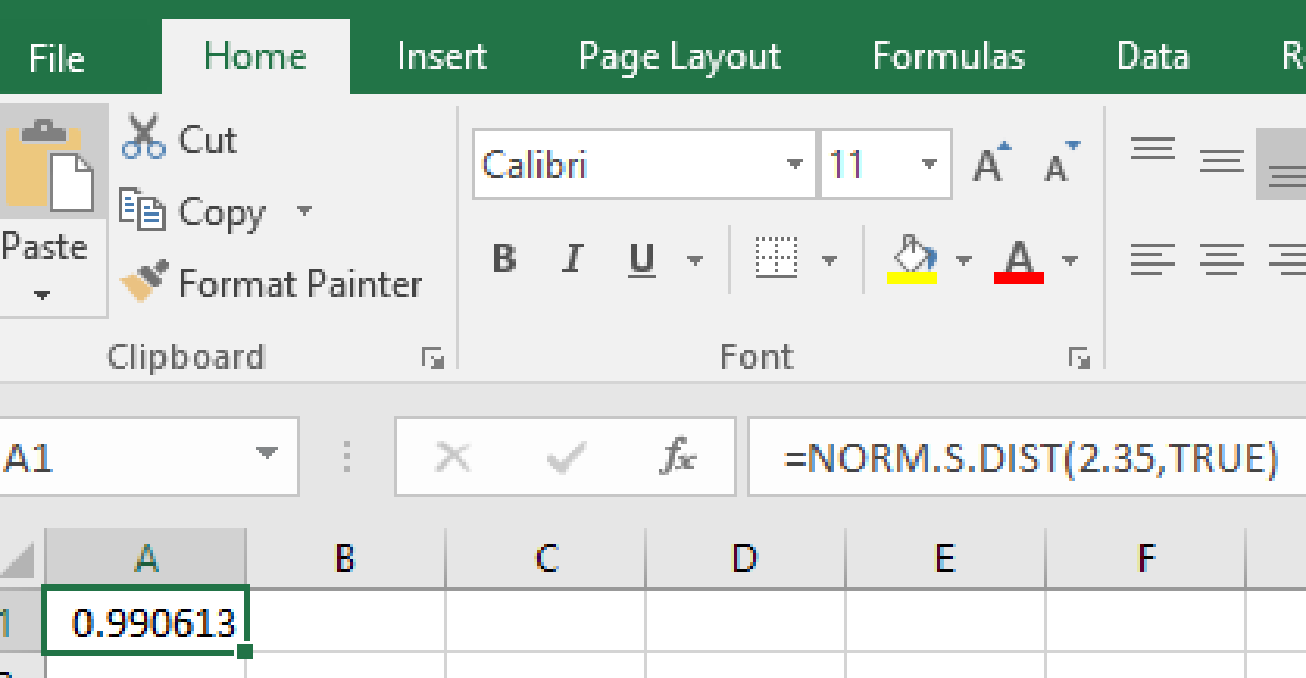
From the output, the p-value for the left tail is 0.990613.
For the upper-tail test, the p-value is
From the output, the result is as calculated:
Thus, the p-value is 0.009.
Rejection rule:
If the
If the
Conclusion:
Here, the p-value is less than the level of significance.
That is, the
From the rejection rule, the null hypothesis is rejected.
Therefore, there is sufficient evidence to conclude that the proportion of rooms occupied in the current year is greater than the previous year.
c.
Obtain the 95% confidence interval estimate of the change in occupancy for the one-year period.
Explain whether the area officials are pleased with the results or not.
Answer to Problem 35E
The 95% confidence interval is
Yes, the area officials are pleased with the results.
Explanation of Solution
Calculation:
The formula for the confidence interval estimate of the difference between two populations is as follows:
Where
Critical value:
From Table 1: Cumulative probabilities for the standard normal distribution are given below:
- Locate the value 0.025 in the table.
- Locate the row and column that are corresponding to the value 0.025.
- The intersecting row and column is 1.96.
The 95% confidence interval estimate of the change in occupancy for the one-year period is obtained below:
Thus, the 95% confidence interval is
Interpretation:
There is 95% chance that the proportion of increase in hotel room occupancy over one-year period lies in between 0.005 and 0.055.
Since there is an increase in the hotel occupancy rate; the officials are expected to be pleased with the occupancy rate.
Want to see more full solutions like this?
Chapter 10 Solutions
ESSEN OF STAT FOR BUS&ECON (LL) >LCPO<


 Linear Algebra: A Modern IntroductionAlgebraISBN:9781285463247Author:David PoolePublisher:Cengage Learning
 Glencoe Algebra 1, Student Edition, 9780079039897...AlgebraISBN:9780079039897Author:CarterPublisher:McGraw Hill
 College Algebra (MindTap Course List)AlgebraISBN:9781305652231Author:R. David Gustafson, Jeff HughesPublisher:Cengage Learning
 Big Ideas Math A Bridge To Success Algebra 1: Stu...AlgebraISBN:9781680331141Author:HOUGHTON MIFFLIN HARCOURTPublisher:Houghton Mifflin Harcourt
 Holt Mcdougal Larson Pre-algebra: Student Edition...AlgebraISBN:9780547587776Author:HOLT MCDOUGALPublisher:HOLT MCDOUGAL
 Algebra: Structure And Method, Book 1AlgebraISBN:9780395977224Author:Richard G. Brown, Mary P. Dolciani, Robert H. Sorgenfrey, William L. ColePublisher:McDougal Littell