
Videos
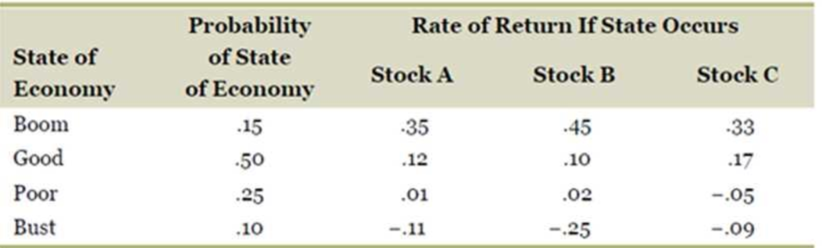
LO1, LO2 10. Returns and Standard Deviations. Consider the following information:
a. Your portfolio is invested 25 percent each in A and C and 50 percent in B. What is the expected return of the portfolio?
b. What is the variance of this portfolio? The standard deviation?
a)
To determine: The expected return on the portfolio.
Introduction:
Expected return refers to the return that the investors expect on a risky investment in the future.
Portfolio expected return refers to the return that the investors expect on a portfolio of investments.
Answer to Problem 10QP
The expected return on the portfolio is 0.1030 or 10.30%.
Explanation of Solution
Given information:
The probability of having a boom, good, poor, and bust economy are 0.15, 0.50, 0.25, and 0.10 respectively. Stock A’s return is 35 percent when the economy is booming, 12 percent when the economy is good, 1 percent when the economy is poor, and −11 percent when the economy is in a bust cycle.
Stock B’s return is 45 percent when the economy is booming, 10 percent when the economy is good, 2 percent when the economy is poor, and −25 percent when the economy is in a bust cycle.
Stock C’s return is 33 percent when the economy is booming, 17 percent when the economy is good, −5 percent when the economy is poor, and −9 percent when the economy is in a bust cycle. The weight of Stock A and Stock C is 25 percent each, and the weight of Stock B is 50 percent in the portfolio.
The formula to calculate the return on portfolio during a particular state of economy:
Where,
Rp refers to the return on portfolio
“x1 to xn” refers to the weight of each asset from 1 to “n” in the portfolio
R1 to Rn” refers to the rate of return on each asset from 1 to “n” in the portfolio
The formula to calculate the portfolio expected return:
Where,
E(RP) refers to the expected return on a portfolio
“x1 to xn” refers to the probability of each asset from 1 to “n” in the portfolio
“E(R1) to E(Rn)” refers to the expected return on each asset from 1 to “n” in the portfolio
Compute the return on portfolio during a boom:
Hence, the return on portfolio during a boom is 0.3950 or 39.50%.
Compute the return on portfolio during a good economy:
Hence, the return on portfolio during a good economy is 12.25%.
Compute the return on portfolio during a poor economy:
Hence, the return on portfolio during a poor economy is 0.000 or 0.00%.
Compute the return on portfolio during a bust cycle:
Hence, the return on portfolio during a bust cycle is −0.1750 or −17.50%.
Compute the expected return on portfolio:
Hence, the expected return on the portfolio is 0.1030 or 10.30%.
b)
To determine: The variance and standard deviation of the portfolio.
Introduction:
Portfolio variance refers to the average difference of squared deviations of the actual data from the mean or expected returns.
Standard deviation refers to the variation in the actual returns from the expected returns of the assets. The square root of variance gives the standard deviation.
Answer to Problem 10QP
The variance of the portfolio is 0.02336. The standard deviation of the portfolio is 15.28 percent.
Explanation of Solution
Given information:
The probability of having a boom, good, poor, and bust economy are 0.15, 0.50, 0.25, and 0.10 respectively. Stock A’s return is 35 percent when the economy is booming, 12 percent when the economy is good, 1 percent when the economy is poor, and −11 percent when the economy is in a bust cycle.
Stock B’s return is 45 percent when the economy is booming, 10 percent when the economy is good, 2 percent when the economy is poor, and −25 percent when the economy is in a bust cycle.
Stock C’s return is 33 percent when the economy is booming, 17 percent when the economy is good, −5 percent when the economy is poor, and −9 percent when the economy is in a bust cycle. The weight of Stock A and Stock C is 25 percent each, and the weight of Stock B is 50 percent in the portfolio.
The formula to calculate the variance of the portfolio:
The formula to calculate the standard deviation:
Compute the variance:
R1 refers to the returns of the portfolio during a boom. The probability of having a boom is P1. R2 is the returns of the portfolio in a good economy. The probability of having a good economy is P2. R3 is the returns of the portfolio in a poor economy. The probability of having a poor economy is P3. R4 is the returns of the portfolio in a bust cycle. The probability of having a bust cycle is P4.
Hence, the variance of the portfolio is 0.02336.
Compute the standard deviation:
Hence, the standard deviation of the portfolio is 0.1528 or 15.28%.
Want to see more full solutions like this?
Chapter 11 Solutions
ESSENTIALS OF CORPORATE FINANCE (LL)


- Below are the returns for two assets; State of nature r1 r2 probability Weak growth 15% 15% 1/3 Strong growth 30% 12 1/3 Very strong growth 45% 9 1/3 Expected returns 30% 12 total 1.0 Calculate the two variances and Cov (r1, r2). If assets 1 and 2 are combined 50-50 into a portfolio, what is the variance of this portfolio? Show your calculations.arrow_forwardplease answer this two ASAP QUESTION 73 What is the VaR of a $10 million portfolio with normally distributed returns at the 5% VaR? Assume the expected return is 13% and the standard deviation is 20%. -13% 19.90% 13% -19.90% QUESTION 74 The geometric average of -12%, 20% and 25% is ________. 18.88% 11% 8.42% 9.7%arrow_forwardD4) Consider two stocks A and B. Both have an expected return of 10%, and their standard deviations are 18% and 16% respectively. Also, their correlation is 0.35. If the risk-free rate of return is 3%, identify the tangency portfolio, and calculate its expected return and standard deviation.arrow_forward
- Suppose the expected return on the tangent portfolio is 10% and its volatility is 40%.The risk-free rate is 2%.(a) What is the equation of the Capital Market Line (CML)?(b) What is the standard deviation of an efficient portfolio whose expected return of8%? How would you allocate $1,000 to achieve this positionarrow_forwardConsider the following information: Rate of Return if State Occurs State of Economy Probability of State of Economy Stock A Stock B Stock C Boom .15 .35 .45 .27 Good .55 .16 .10 .08 Poor .25 -.01 -.06 -.04 Bust .05 -.12 -.20 -.09 a) Your portfolio is invested 40 percent each in A and C, and 20 percent in B. What is the expected return of the portfolio? b) What is the variance of this portfolio? The standard deviation? Stock C .45 .27 .10 .08 -.06 -.04 -.20 -.09arrow_forwardAn investment has a 20% chance of producing a 25% return, a 60%chance of producing a 10% return, and a 20% chance of producinga 215% return. What is its expected return? (8%) What is itsstandard deviation? (12.9%)arrow_forward
- If your portfolio is invested in 40% Alpha, 40% Beta, and 20% in Delta, what is the expected return of the portfolio? The variance of the portfolio? The standard deviation? Economy: boom,normal,bust Probability--25%,60%,15%. Alpha Stock Return: 13%,8%,2%. Beta returns: 29%,11%,-18.00%. Delta returns: 60%,13%,-45.00%arrow_forwardSuppose the risk-free rate is 5.1 percent and the market portfolio has an expected return of 11.8 percent. The market portfolio has a variance of .0472. Portfolio Z has a correlation coefficient with the market of .37 and a variance of .3375 According to the capital asset pricing model, what is the expected return on Portfolio Z?arrow_forwardAn investor invests 70% of his wealth in a risky asset with an expected rate of return of 0.15 and a variance of 0.04. He also places 30% of his wealth in a T-bill that pays 5%. His portfolio's expected return and standard deviation are __________ and __________, respectively. Group of answer choices 0.120; 0.14 0.087; 0.06 0.295; 0.12 0.087; 0.12 0.895; 0.11arrow_forward
- Assume that an investment is forecasted to produce the following returns: a 20% probability of a 12% return; a 50% probability of a 16% return; and a 30% probability of a 19% return What is the standard deviation of return for this investment? A) 5.89% B) 16.1% C) 2.43% D) 15.7%arrow_forwardConsider 2 scenarios: Boom Economy and Normal Economy. The Boom economy has 30% chance of happening, while Normal economy has 70% chance of happening. For each scenario (Boom and Normal), stock ABC has a return of 25%, and 4%, respectively; stock XYZ has a return of 10% and 6.5%, respectively; the market portfolio has a return of 12% and 5% respectively. 1) Calculate Expected return, Variance and Standard deviation for stock ABC and XYZ 2) Based on your results in part (1), can you decide which stock to invest? 3) Calculate Beta for stock ABC and XYZ 4) If the T-bill rate is 3%, what does the CAPM say about the fair expected rate of return on the two stocks? How does this result influence your investment decision?arrow_forwardEXAMPLE: PORTFOLIO VARIANCE• Consider the following information on returnsand probabilities:▪ Invest 50% of your money in Asset A State Probability A B PortfolioBoom .4 30% -5% 12.5%Bust .6 -10% 25% 7.5%• What are the expected return and standarddeviation for each asset?• What are the expected return and standarddeviation for the portfolio?arrow_forward

 Intermediate Financial Management (MindTap Course...FinanceISBN:9781337395083Author:Eugene F. Brigham, Phillip R. DavesPublisher:Cengage Learning