
Concept explainers
Videos
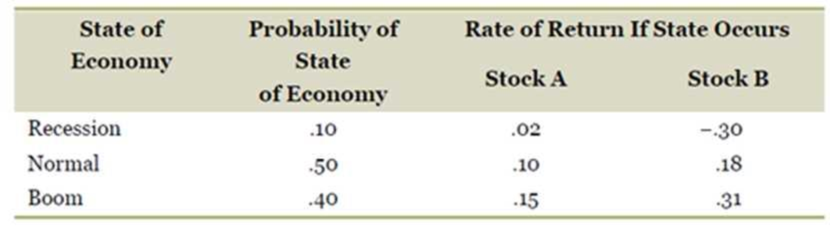
Calculating Returns and Standard Deviations. Based on the following information, calculate the expected return and standard deviation for the two stocks.
To determine: The expected return of Stock A and Stock B.
Introduction:
Expected return refers to the return that the investors expect on a risky investment in the future.
Answer to Problem 7QP
The expected return of Stock A is 11.20 percent.
The expected return of Stock B is 18.40 percent.
Explanation of Solution
Given information:
Stock A’s rate of return is 2 percent when the economy is in a recession, 10 percent when the economy is normal, and 15 percent when the economy is in a boom.
Stock B’s rate of return is −30 percent when the economy is in a recession, 18 percent when the economy is normal, and 31 percent when the economy is in a boom.
The probability of having a recession is 10 percent, the probability of having a normal economy is 50 percent, and the probability of having a booming economy is 40 percent.
The formula to calculate the expected return on the stock:
Where,
R1 refers to the rate of returns during the recession economy,
Rn refers to the rate of returns for “n” number of items,
P1 refers to the probability of having a recession economy,
Pn refers to the probability of having “n” number of economy.
Compute the expected return on Stock A:
Hence, the expected return on Stock A is 0.1120 or 11.20 percent.
Compute the expected return on Stock B:
Hence, the expected return on Stock B is 0.1840 or 18.40 percent.
To determine: The standard deviation of Stock A and Stock B.
Introduction:
Standard deviation refers to the variation in the actual returns from the expected returns.
Answer to Problem 7QP
The standard deviation of Stock A is 3.87 percent.
The standard deviation of Stock B is 17.26 percent.
Explanation of Solution
Given information:
Stock A’s rate of return is 2 percent when the economy is in a recession, 10 percent when the economy is normal, and 15 percent when the economy is in a boom.
Stock B’s rate of return is −30 percent when the economy is in a recession, 18 percent when the economy is normal, and 31 percent when the economy is in a boom.
The probability of having a recession is 10 percent, the probability of having a normal economy is 50 percent, and the probability of having a booming economy is 40 percent.
The formula to calculate the standard deviation of the stock:
Compute the standard deviation of Stock A:
Hence, the standard deviation of Stock A is 0.0387 or 3.87 percent.
Compute the standard deviation of Stock B:
Hence, the standard deviation of Stock B is 0.1726 or 17.26 percent.
Want to see more full solutions like this?
Chapter 11 Solutions
ESSENTIALS OF CORPORATE FINANCE (LL)


- What is a characteristic line? How is this line used to estimate a stocks beta coefficient? Write out and explain the formula that relates total risk, market risk, and diversifiable risk.arrow_forwardCalculate the correlation coefficient between Blandy and the market. Use this and the previously calculated (or given) standard deviations of Blandy and the market to estimate Blandy’s beta. Does Blandy contribute more or less risk to a well-diversified portfolio than does the average stock? Use the SML to estimate Blandy’s required return.arrow_forwardWhat is the correlation between returns of stock S and T, given that covariance between stocks is 2.419 and standard deviation are 1.23 and 2.21, respectively.arrow_forward
- a. what is return on each of the three shortlisted stock? and what is the standard deviation of the rate of return on the three shortlisted stocks?arrow_forwardAhmed observed the following data of two stocks as shown in the below table. Which stock do you advise Ahmed to select according to the required rate of return? And explain why? (picture)arrow_forwardhow to calculate a stocks average monthly returnn, its return variance, standard deviation and betasarrow_forward
- You are given the following information regarding prices for a sample of stocks.a. Construct a price-weighted index for these three stocks, and compute the percentagechange in the index for the period from T to T + 1. b. Construct a value-weighted index for these three stocks, and compute the percentagechange in the index for the period from T to T + 1. c. Briefly discuss the difference in the results for the two indexes.arrow_forwardThe market and Stock J have the following probability distributions: ProbabIlity rM rJ 0.3 15% 20% 0.4 9 5 0.3 18 12 A. Calculate the expected rates of return for the market and Stock J. B. Calculate the standard deviations for the market and Stock Jarrow_forwardThe market and Stock J have the following probability distributions: Probability rM rJ 0.3 15% 20% 0.4 9 5 0.3 18 12 Calculate the expected rates of return for the market and Stock J. Calculate the standard deviations for the market and Stock J. Calculate the coefficients of variation for the market and Stock J.arrow_forward
- Calculate the variance and standard deviation of each stockarrow_forwardFrom the following information, calculate covariance between stocks A and B and expected return and risk of a portfolio in which A and B are equally weighted.Which stock would be recommend if investment in individual stock is to be made? Justify answer using numerical calculations. Stock A Stock B Expected return 24% 35% Standard deviation 12% 18% Coefficient of correlation 0.65 0.65arrow_forwardhow do you calculate a stocks average monthly return,its return variance ,standard deviation and beta? what is the formulaarrow_forward
 Intermediate Financial Management (MindTap Course...FinanceISBN:9781337395083Author:Eugene F. Brigham, Phillip R. DavesPublisher:Cengage Learning
 EBK CONTEMPORARY FINANCIAL MANAGEMENTFinanceISBN:9781337514835Author:MOYERPublisher:CENGAGE LEARNING - CONSIGNMENT
 Pfin (with Mindtap, 1 Term Printed Access Card) (...FinanceISBN:9780357033609Author:Randall Billingsley, Lawrence J. Gitman, Michael D. JoehnkPublisher:Cengage Learning
