
STAT.F/BUS.+ECO.PKG.:LOOSELEAF+MYLABSPL
13th Edition
ISBN: 9780135412428
Author: MCCLAVE
Publisher: PEARSON C
expand_more
expand_more
format_list_bulleted
Concept explainers
Videos
Textbook Question
Chapter 11, Problem 11.115ACI
Evaluating a truck weigh-in-motion program. The Minnesota Department of Transportation installed a state-of-the-art weigh-in-motion scale in the concrete surface of the eastbound lanes of Interstate 494 in Bloomington, Minnesota. After installation. a study was undertaken to determine whether the scale’s readings correspond to the static weights of the vehicles being monitored. (Studies of this type are known as calibration studies.) After some preliminary comparisons using a two-axle, six-tire truck carrying different loads (see the accompanying table), calibration adjustments were made in the software of the weigh-in-motion system, and the scales were reevaluated.
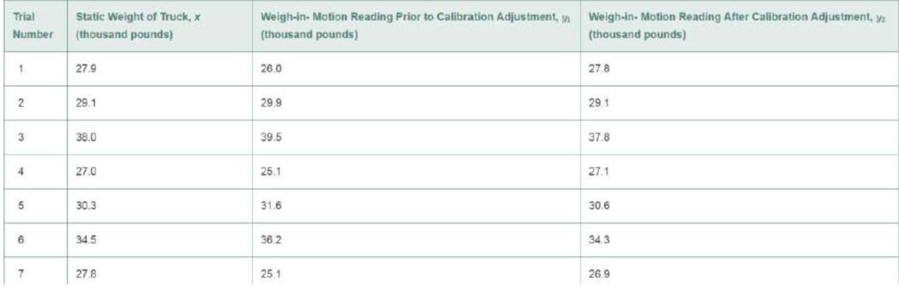
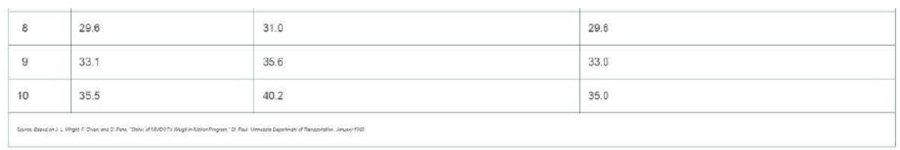
- a. Construct two
scatterplots . one of y1 versus x and the other of y2 versus x. - b. Use the scatterplots of part a to evaluate the performance of the weigh-in-motion scale both before and after the calibration adjustment.
- c. Calculate the
correlation coefficient for both sets of data and Interpret their values. Explain how these correlation coefficients can be used to evaluate the weigh-in-motion scale. - d. Suppose the sample correlation coefficient for y1 and x was 1. Could this happen if the static weights and the weigh-in-motion readings disagreed? Explain.
Expert Solution & Answer
Want to see the full answer?
Check out a sample textbook solution
Students have asked these similar questions
GreenLawns provides a lawn fertilizing and weed control service. The company is adding a special aeration treatment as a low-cost extra service option, which it hopes will help attract new customers. Management is planning to promote this new service in two media: radio and direct-mail advertising. A media budget of $4,000 is available for this promotional campaign. Based on past experience in promoting its other services, GreenLawns has obtained the following estimate of the relationship between sales and the amount spent on promotion in these two media:
S = -2R2 − 12M2 − 9RM + 20R + 39M,
Where
S = total sales in thousands of dollars
R = thousands of dollars spent on radio advertising
M = thousands of dollars spent on direct-mail advertising
GreenLawns would like to develop a promotional strategy that will lead to maximum sales subject to the restriction provided by the media budget.
(a)
What is the value of sales if $3,000 is spent on radio advertising and $1,000 is…
Cell Phone Radiation Listed below are the measured radiation absorption rates (in W/kg) corresponding to these cell phones: iPhone 5S, BlackBerry Z30, Sanyo Vero, Optimus V, Droid Razr, Nokia N97, Samsung Vibrant, Sony Z750a, Kyocera Kona, LG G2, and Virgin Mobile Supreme. The data are from the Federal Communications Commission (FCC). The media often report about the dangers of cell phone radiation as a cause of cancer. The FCC has a standard that a cell phone absorption rate must be 1.6 W/kg or less. If you are planning to purchase a cell phone, are any of the measures of center the most important statistic? Is there another statistic that is most relevant? If so, which one?
Which of the following statements correctly describe estimation?
a. It is the process of inferring the values of known population parameters from those of unknown sample statistics.
b. It is the process of inferring the values of unknown population parameters from those of known sample statistics.
c. It is the process of inferring the values of known sample statistics from those of unknown population parameters.
d. It is the process of inferring the values of unknown sample statistics from those of known population parameters.
Chapter 11 Solutions
STAT.F/BUS.+ECO.PKG.:LOOSELEAF+MYLABSPL
Ch. 11.1 - In each case, graph the line that passes through...Ch. 11.1 - Give the slope and y-intercept for each of the...Ch. 11.1 - The equation for a straight line (deterministic...Ch. 11.1 - Refer to Exercise 11.3. Find the equations of the...Ch. 11.1 - Plot the following lines: a. y 4 + x b. y = 5 2x...Ch. 11.1 - Give the slope and y-intercept for each of the...Ch. 11.1 - Prob. 11.7LMCh. 11.1 - Prob. 11.8LMCh. 11.1 - If a straight-line probabilistic relationship...Ch. 11.1 - Congress voting on women's issues. The American...
Ch. 11.1 - Best-paid CEOs. Refer to Glassdoor Economic...Ch. 11.1 - Estimating repair and replacement costs of water...Ch. 11.1 - Forecasting movie revenues with Twitter. A study...Ch. 11.2 - The following table is similar to Table 11.2.It is...Ch. 11.2 - Refer to Exercise 11.14. After the least squares...Ch. 11.2 - Construct a scatterplot for the data in the...Ch. 11.2 - Consider the following pairs of measurements: a....Ch. 11.2 - Use the applet Regression by Eye to explore the...Ch. 11.2 - In business, do nice guys finish first or last?...Ch. 11.2 - State Math SAT scores. Refer to the data on...Ch. 11.2 - Lobster fishing study. Refer to the Bulletin of...Ch. 11.2 - Repair and replacement costs of water pipes. Refer...Ch. 11.2 - Joint Strike Fighter program. The Joint Strike...Ch. 11.2 - Software millionaires and birthdays. In Outliers:...Ch. 11.2 - Prob. 11.24ACICh. 11.2 - Ranking driving performance of professional...Ch. 11.2 - Sweetness of orange juice. The quality of the...Ch. 11.2 - Forecasting movie revenues with Twitter. Marketers...Ch. 11.2 - Charisma of top-level leaders. According to a...Ch. 11.2 - Ran kings of research universities. Refer to the...Ch. 11.2 - Prob. 11.30ACACh. 11.3 - Visually compare the scatterplots shown below. If...Ch. 11.3 - Calculate SSE and s2 for each of the following...Ch. 11.3 - Suppose you fit a least squares line to 26 data...Ch. 11.3 - Refer to Exercise 11.14 (p. 629). Calculate SSE,...Ch. 11.3 - Do nice guys really finish last in business? Refer...Ch. 11.3 - State Math SAT scores. Refer to the simple linear...Ch. 11.3 - Prob. 11.37ACBCh. 11.3 - Prob. 11.38ACBCh. 11.3 - Prob. 11.39ACBCh. 11.3 - Prob. 11.40ACICh. 11.3 - Prob. 11.41ACICh. 11.3 - Sweetness of orange juice. Refer to the study of...Ch. 11.3 - Rankings of research universities. Refer to the...Ch. 11.3 - Life tests of cutting tools. To Improve the...Ch. 11.4 - Construct both a 95% and a 90% confidence interval...Ch. 11.4 - Consider the following pairs of observations: a....Ch. 11.4 - Refer to Exercise 11.46. Construct an 80% and a...Ch. 11.4 - Do the accompanying data provide sufficient...Ch. 11.4 - State Math SAT Scores. Refer to the SPSS simple...Ch. 11.4 - Lobster fishing study. Refer to the Bulletin of...Ch. 11.4 - Prob. 11.51ACBCh. 11.4 - Prob. 11.52ACBCh. 11.4 - Estimating repair and replacement costs of water...Ch. 11.4 - Prob. 11.54ACBCh. 11.4 - Prob. 11.55ACICh. 11.4 - Beauty and electoral success. Are good looks an...Ch. 11.4 - Prob. 11.57ACICh. 11.4 - Prob. 11.58ACICh. 11.4 - Prob. 11.59ACICh. 11.4 - Prob. 11.60ACICh. 11.4 - Rankings of research universities. Refer to the...Ch. 11.4 - Prob. 11.62ACACh. 11.4 - Does elevation impact hitting performance in...Ch. 11.5 - Explain what each of the following sample...Ch. 11.5 - Describe the slope of the least squares line if a....Ch. 11.5 - Construct a scatterplot for each data set. Then...Ch. 11.5 - Calculate r2 for the least squares line in each of...Ch. 11.5 - Use the applet Correlation by Eye to explore the...Ch. 11.5 - In business, do nice guys finish first or last?...Ch. 11.5 - Going for it on fourth-down in the NFL Each week...Ch. 11.5 - Lobster fishing study. Refer to the Bulletin of...Ch. 11.5 - RateMyProfessors.com. A popular Web site among...Ch. 11.5 - Last name and acquisition timing. Refer to the...Ch. 11.5 - Women in top management. An empirical analysis of...Ch. 11.5 - Prob. 11.74ACICh. 11.5 - Prob. 11.75ACICh. 11.5 - Prob. 11.76ACICh. 11.5 - Prob. 11.77ACICh. 11.5 - Prob. 11.78ACICh. 11.5 - Evaluation of an imputation method for missing...Ch. 11.5 - Prob. 11.80ACICh. 11.5 - Prob. 11.81ACACh. 11.6 - Consider the followings of measurements: a...Ch. 11.6 - Consider the pairs of measurements shown in the...Ch. 11.6 - In fitting a least squares line to n = 10 data...Ch. 11.6 - Prob. 11.86ACBCh. 11.6 - Prob. 11.87ACBCh. 11.6 - Prob. 11.88ACBCh. 11.6 - Prob. 11.89ACBCh. 11.6 - Prob. 11.90ACBCh. 11.6 - Prob. 11.91ACICh. 11.6 - Ranking driving performance of professional...Ch. 11.6 - Spreading rate of spilled liquid Refer to the...Ch. 11.6 - Removing nitrogen from toxic wastewater. Highly...Ch. 11.6 - Predicting quit rates In manufacturing The reasons...Ch. 11.6 - Life tests of cutting tools Refer to the data...Ch. 11.7 - Prices of recycled materials. Prices of recycled...Ch. 11.7 - Thickness of dust on solar cells. The performance...Ch. 11.7 - Management research In Africa. The editors of the...Ch. 11.7 - An MBAs work-life balance. The importance of...Ch. 11 - In fitting a least squares line ton= 15 data...Ch. 11 - Consider the following sample data. a. Construct a...Ch. 11 - Consider the following 10 data points. a. Plot the...Ch. 11 - Drug controlled-release rate study. The effect of...Ch. 11 - Metaskills and career management. Effective...Ch. 11 - Burnout of human services professionals. Emotional...Ch. 11 - Retaliation against company whistle-blowers....Ch. 11 - Extending the life of an aluminum smelter pot. An...Ch. 11 - Diamonds sold at retail. Refer to the Journal of...Ch. 11 - Sports news on local TV broadcasts. The Sports...Ch. 11 - Evaluating managerial success. An observational...Ch. 11 - Doctors and ethics. Refer to the Journal of...Ch. 11 - FCAT scores and poverty. In the state of Florida,...Ch. 11 - Monetary values of NFL teams. Refer to the Forbes...Ch. 11 - Evaluating a truck weigh-in-motion program. The...Ch. 11 - Energy efficiency of buildings. Firms conscious of...Ch. 11 - Forecasting managerial needs. Managers are an...Ch. 11 - Prob. 11.118ACACh. 11 - Prob. 11.119CTCCh. 11 - Prob. 11.120CTC
Knowledge Booster


Learn more about
Need a deep-dive on the concept behind this application? Look no further. Learn more about this topic, statistics and related others by exploring similar questions and additional content below.Similar questions
- Urban Travel Times Population of cities and driving times are related, as shown in the accompanying table, which shows the 1960 population N, in thousands, for several cities, together with the average time T, in minutes, sent by residents driving to work. City Population N Driving time T Los Angeles 6489 16.8 Pittsburgh 1804 12.6 Washington 1808 14.3 Hutchinson 38 6.1 Nashville 347 10.8 Tallahassee 48 7.3 An analysis of these data, along with data from 17 other cities in the United States and Canada, led to a power model of average driving time as a function of population. a Construct a power model of driving time in minutes as a function of population measured in thousands b Is average driving time in Pittsburgh more or less than would be expected from its population? c If you wish to move to a smaller city to reduce your average driving time to work by 25, how much smaller should the city be?arrow_forwardOverhead Door (OD) Corporation’s founder, C. G. Johnson, invented the upward-lifting garage door in 1921 and the electric garage door opener in 1926. Since then OD has been a leading supplier of commercial, industrial, and residential garage doors sold through a nationwide network of more than 450 authorized distributors. They have built a solid reputation as a premier door supplier, commanding 15 % share of the market. Suppose that customers assess door quality first in terms of the ease of operation, followed by its durability. The quality improvement team (QIT) might then assign an engineering team to determine the factors that contribute to these two main problems. Smooth operation of a garage door is a critical quality characteristic that affects both problems: If a door is too heavy, it’s difficult and unsafe to balance and operate; if it’s too light, it tends to buckle and break down frequently or may not close properly. Suppose the design engineers determine that a standard…arrow_forwardIdentify the Level of Measurement for each of the following variables: The Social Security System (SSS) number assigned to employees of a certain private institution Service classification as “poor, fair, good, very good, excellent” The air classification as healthy or unhealthy, based on the air quality index (AQI) Types of investments (Stocks, Bonds, others) Standardized exam score (e.g. Board exam score) The cost of an I.T. system Time to execute a command in a computer programarrow_forward
- Candy Bar Weight, x Calories, yHershey’s Milk Chocolate®Nestle’s Crunch®Butterfinger®Baby Ruth®Almond Joy®Twix® (with caramel)Snickers®Heath® 44.2844.8461.3066.4547.3358.0061.1239.52 230230270280220280280210Source: Megan Pocius, student at Joliet Junior College(a) Draw a scatter diagram of the data, treating weight asthe independent variable.(b) What type of relation appears to exist between theweight of a candy bar and the number of calories?(c) Select two points and find a linear model that containsthe points.(d) Graph the line on the scatter diagram drawn inpart (a).(e) Use the linear model to predict the number of calories ina candy bar that weighs 62.3 grams.(f) Interpret the slope of the line found in part (c).arrow_forwardAlthough a large number of tasks in the computer industry are robotic, many operations require human workers. Some jobs require a great deal of dexterity to properly position components into place. A large North American computer maker routinely tests applicants for these jobs by giving a dexterity test that involves a number of intricate finger and hand movements. The tests are scored on a 100-point scale. Only those who have scored above 70 are hired. To determine whether the tests are valid predictors of job performance, the personnel manager drew a random sample of 45 workers who were hired 2 months ago. He recorded their test scores and the percentage of nondefective computers they produced in the last week. Determine the regression line and interpret the coefficients by using a 5% significance level. PLEASE ONLY USE EXCEL AND SHOW ALL EXCEL COMMANDS! Test Nondefective 79 93 81 93 79 94 79 91 76 94 81 94 79 94 79 92 82 93 86 93 83 92 78 95 77 92 77…arrow_forwardBreast feeding sometimes results in a temporary loss of bone mass as calcium is depleted in the mother's body to provide for milk production. An investigation gave the following data on total body bone mineral content (g) for a sample of mothers both during breast feeding (B) and in the postweaning period (P). Subject 1 2 3 4 5 6 7 8 9 10 B 2170 1840 2563 2348 2721 2601 2386 2640 2549 1852 P 2300 1994 2594 2523 2852 2774 2534 2829 2578 2039 Do the data suggest that true average total body bone mineral content during postweaning exceeds that during breast feeding by more than 25 g? State and test the appropriate hypotheses using a significance level of 0.05. (Use a statistical computer package to calculate the P-value. Use ?P − ?B. Round your test statistic to two decimal places and your P-value to three decimal places.) t = df = P-value = Conclusion Fail to reject H0. OR Reject H0.arrow_forward
- GreenLawns provides a lawn fertilizer and weed control service. The company is adding a special aeration treatment as a low-cost extra service option, which it hopes will help attract new customers. Management is planning to promote this new service in two media: radio and direct-mail advertising. A media budget of $3,500 is available for this promotional campaign. Based on past experience in promoting its other services, GreenLawns obtained the following estimate of the relationship between sales and the amount spent on promotion in these two media. S = −2R2 − 10M2 − 8RM + 18R + 34M where S = total sales in thousands of dollars R = thousands of dollars spent on radio advertising M = thousands of dollars spent on direct-mail advertising. GreenLawns would like to develop a promotional strategy that will lead to maximum sales subject to the restriction provided by the media budget. (a) What is the value of sales (in dollars) if $2,500 is spent on radio advertising and $1,000 is…arrow_forwardBecause of safety considerations, in May 2003 the Federal Aviation Administration (FAA) changed its guidelines for how small commuter airlines must estimate passenger weights. Under the old rule, airlines used 180 pounds as a typical passenger weight (including carry-on luggage) in warm months and 185 pounds as a typical weight in cold months. A journal reported that an airline conducted a study to estimate average passenger plus carry-on weights. They found an average summer weight of 183 pounds and a winter average of 190 pounds. Suppose that each of these estimates was based on a random sample of 100 passengers and that the sample standard deviations were 15 pounds for the summer weights and 21 pounds for the winter weights. (a) Construct a 95% confidence interval for the mean summer weight (including carry-on luggage) of this airline's passengers. (Use technology to calculate the critical value. Round your answers to three decimal places.) ( , )…arrow_forwardYou may need to use the appropriate technology to answer this question. An automobile dealer conducted a test to determine if the time in minutes needed to complete a minor engine tune-up depends on whether a computerized engine analyzer or an electronic analyzer is used. Because tune-up time varies among compact, intermediate, and full-sized cars, the three types of cars were used as blocks in the experiment. The data obtained follow. Analyzer computerized electronic Car compact 50 41 Intermediate 56 45 Full Sized 62 46 Use ? = 0.05 to test for any significant differences. State the null and alternative hypotheses. H0: ?Computerized = ?ElectronicHa: ?Computerized ≠ ?ElectronicH0: ?Computerized ≠ ?ElectronicHa: ?Computerized = ?Electronic H0: ?Computerized = ?Electronic = ?Compact = ?Intermediate = ?Full-sizedHa: Not all the population means are equal.H0: ?Compact = ?Intermediate = ?Full-sizedHa: ?Compact ≠ ?Intermediate ≠ ?Full-sizedH0:…arrow_forward
- Cell Phone Radiation Listed below are the measured radiation absorption rates (in W/kg) corresponding to these cell phones: iPhone 5S, BlackBerry Z30, Sanyo Vero, Optimus V, Droid Razr, Nokia N97, Samsung Vibrant, Sony Z750a, Kyocera Kona, LG G2, and Virgin Mobile Supreme. The data are from the Federal Communications Commission. If one of each model of cell phone is measured for radiation and the results are used to find the measures of variation, are the results typical of the population of cell phones that are in use?arrow_forwardIn an ongoing nationwide survey, a question asked is whether a respondent favors or opposes capital punishment (the death penalty) for persons convicted of murder. The output for this exercise compares the proportions who said that they were opposed to the death penalty in the year 2008 and the year 1993. Sample X N Sample p 2008 637 1912 0.333 1993 333 1418 0.235 Estimate for p(1) − p(2): 0.098 95% CI for p(1) − p(2): (0.068, 0.129) (a) What proportion of the year 2008 sample was opposed to the death penalty? (Round your answer to three decimal places.) What proportion of the year 1993 sample was opposed? (Round your answer to three decimal places.) (b) What is the estimated difference between the proportions opposed to the death penalty in the 2 years? (Use p2008 − p1993. Round your answer to three decimal places.) (c) Write the 95% confidence interval as it is given in the output. to Interpret this interval in the context of this situation. There is a…arrow_forwardDetermine if the following scenarios involve an observational study or an experiment. Make sure your answers are legible and spelled correctly. A team of ecologists determines the different species of frogs that live in the local swamplands. A medical researcher divides patients into a treatment group and a control group to determine the effect of a new drug on overall cholesterol levels in patients. A medical insurance company determines the average cost to cover a tooth extraction procedure over the past 3 years. As part of a medical study to determine the effectiveness of a new technique for abdominal surgery, patients undergo the surgery with the new technique or with a traditional technique. The recovery time from surgery is then compared for the two different techniques. The general manager of a baseball team determines the on-base percentage (OBP) for his players over the past two seasons. A dietitian examined the effectiveness of a weight-loss program by randomly…arrow_forward
arrow_back_ios
SEE MORE QUESTIONS
arrow_forward_ios
Recommended textbooks for you
 Functions and Change: A Modeling Approach to Coll...AlgebraISBN:9781337111348Author:Bruce Crauder, Benny Evans, Alan NoellPublisher:Cengage Learning
 Linear Algebra: A Modern IntroductionAlgebraISBN:9781285463247Author:David PoolePublisher:Cengage Learning
Functions and Change: A Modeling Approach to Coll...
Algebra
ISBN:9781337111348
Author:Bruce Crauder, Benny Evans, Alan Noell
Publisher:Cengage Learning
Linear Algebra: A Modern Introduction
Algebra
ISBN:9781285463247
Author:David Poole
Publisher:Cengage Learning
Statistics 4.1 Point Estimators; Author: Dr. Jack L. Jackson II;https://www.youtube.com/watch?v=2MrI0J8XCEE;License: Standard YouTube License, CC-BY
Statistics 101: Point Estimators; Author: Brandon Foltz;https://www.youtube.com/watch?v=4v41z3HwLaM;License: Standard YouTube License, CC-BY
Central limit theorem; Author: 365 Data Science;https://www.youtube.com/watch?v=b5xQmk9veZ4;License: Standard YouTube License, CC-BY
Point Estimate Definition & Example; Author: Prof. Essa;https://www.youtube.com/watch?v=OTVwtvQmSn0;License: Standard Youtube License
Point Estimation; Author: Vamsidhar Ambatipudi;https://www.youtube.com/watch?v=flqhlM2bZWc;License: Standard Youtube License