
Concept explainers
Videos
For Exercises 1 through 10, follow these steps.
a. State the hypotheses and identify the claim.
b. Find the critical value(s).
c. Compute the test value.
d. Make the decision.
e. Summarize the results.
Use the traditional method of hypothesis testing unless otherwise specified. Assume all assumptions have been met.
1. Traffic Accident Fatalities A traffic safety report indicated that for the 21–24 year age group, 31.58% of traffic fatalities were victims who had used a seat belt. Victims who were not wearing a seat belt accounted for 59.83% of the deaths, and the status of the rest was unknown. A study of 120 randomly selected traffic fatalities in a particular region showed that for this age group, 35 of the victims had used a seat belt, 78 had not, and the status of the rest was unknown. At α = 0.05, is there sufficient evidence that the proportions differ from those in the report?
Source: New York Times Almanac.
(a)
To state: The hypothesis and the claim.
Answer to Problem 11.1.1RE
The null and alternative hypotheses are:
And the claim of the test is the observed proportion is different from the reported proportion.
Explanation of Solution
Given info:
The percentage of death and the observed count corresponding to each reason are provided in the question. The level of significance is
Justification:
The researcher wants to know that whether the proportion of the traffic fatalities corresponding to each reason is different from the reported proportion or not. The null and alternative hypothesis can be defined as:
Null hypothesis:
Alternative hypothesis:
In the provided situation, the claim of the study will be the observed proportion corresponding to each reason is different from the reported proportion.
(b)
The critical value.
Answer to Problem 11.1.1RE
The required critical value is 5.991.
Explanation of Solution
The required critical value is obtained from the provided chi-square table in the textbook. The number of categories is 3.
The degrees of freedom is calculated as:
Therefore, the critical value at
(c)
The value of the test statistic.
Answer to Problem 11.1.1RE
The test statistic value is 1.819.
Explanation of Solution
Calculation:
Software procedure:
Step-by-step procedure to obtain the test statistic using the MINITAB software:
- Enter the data in the Minitab worksheet.
- Go to Stat> Tables> Chi-Square Goodness-of-Fit Test (one variable).
- Specify the “Observed count”, choose the option “Proportions specified by historic count”, and specify the column where the percentage is written.
- Click on OK.
Output using the MINITAB software is given below:
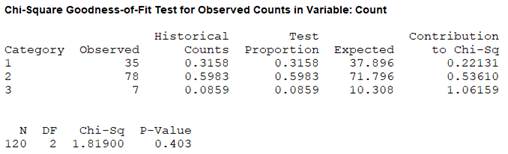
Therefore, the obtained value of the test statistic is 1.819.
(d)
To make: The decision.
Answer to Problem 11.1.1RE
The null hypothesis will not be rejected.
Explanation of Solution
The obtained value of the test statistic is 1.819 and the critical value is 5.991. As the obtained value of the chi-square statistic is less than the critical value, it can be said that there is not enough evidence to reject the null hypothesis at
(e)
To summarize: The results.
Answer to Problem 11.1.1RE
According to the obtained result, the claim of the study is not true.
Explanation of Solution
The null hypothesis is not rejected. On the basis of the obtained result, it can be concluded that the result of the proportion of the traffic fatalities is not different from the reported proportion at
Want to see more full solutions like this?
Chapter 11 Solutions
ELEMENTARY STATISTICS: STEP BY STEP- ALE


- Given that the P-value for the hypothesis test is 0.501, what do you conclude? Does it appear that the heights were obtained through measurement or that the subjects reported their heights?arrow_forwardUse the 7 steps in Hypothesis Testing in answering the problems below.arrow_forwardSolve the problems by following the steps and procedures in hypothesis testing. PRACTICE QUESTIONarrow_forward
- You are given the following hypotheses H 0 :p=0.3 H A :p not equal 0.3 We know that the sample size 90. For what sample proportion would the pvalue be equal to 0.1? Assume that all conditions necessary for Inference are satisfied.arrow_forwardState the null and alternative hypotheses to be used in testing the following claims also explain type of test.(a) At most, 20% of next year’s wheat crop will be exported to the Soviet Union.(b) On the average, American homemakers drink 3 cups of coffee per day.(c) The proportion of college graduates in Virginia this year who majored in the social sciences is at least 0.15.(d) The average donation to the American Lung Association is no more than $10.(e) Residents in suburban Richmond commute, on the average, 15 kilometers to their place of employmentarrow_forwardA dental assistant is interested in the proportion of patients that need a root canal. Let the proportion of patients that need a root canal be p. If the dental assistant wanted to know if the proportion of patients that need a root canal is more than 20%, what are the null and alternative hypotheses? Select the correct answer below: H0: p=0.20; Ha: p<0.20 H0: p>0.20; Ha: p=0.20 H0: p=0.20; Ha: p>0.20 H0: μ=0.20; Ha: μ>0.20arrow_forward
- If the proportion of the population in City A that is over 65 years old is p1 and the proportion of the population in City B that is over 65 years old is p2, what is the null hypothesis for a test to determine if the proportion of the population that is over 65 years old is greater in City A? Select the correct answer below: H0: p1−p2=0 H0: p1−p2>0 H0: p1−p2<0 H0: p1−p2≠0arrow_forwardYou are working for the South Tahoe Tourist Bureau and are interested in determining if there is a relationship between the casino people frequent and the type of gambling that they do at the casino Table Games Slots Sports Harrah’s 50 60 12 Hard Rock 18 22 6 MontBleu 33 29 20 Harvey’s 41 39 20 a. State the null and alternative hypotheses. b. State which hypothesis test should be used. Calculate the p-Value and state the command you entered in the calculator. c. State the conclusion in the context of the problem.arrow_forwardThe academic planner of a university thinks that less than 35% of the entire student body attends summer school. The correct set of hypotheses to verify his belief is _____.arrow_forward
- Brown wants to conduct an assessment of where employees live and how employees work. Brown wanted to know if where you lived was related to how you worked. What hypothesis tests can be used in this case?arrow_forwardAn economist has collected data on the number of house foreclosures. The published share of housing units with a foreclosure filing is 0.47%. The economist believes, based on the data she collected, that the share of housing units with a foreclosure filing is different from 0.47%. What are the null and alternative hypotheses? Select the correct answer below: H0: μ≠0.47%; Ha: μ=0.47% H0: μ=0.47%; Ha: μ≥0.47% H0: μ=0.47%; Ha: μ≤0.47% H0: μ=0.47%; Ha: μ≠0.47%arrow_forwardSee image below: Identify the null hypothesis, alternative hypothesis, test statistic, P-value or critical value(s), conclusion about the null hypothesis, and final conclusion that addresses the original claim.arrow_forward
 MATLAB: An Introduction with ApplicationsStatisticsISBN:9781119256830Author:Amos GilatPublisher:John Wiley & Sons Inc
 Probability and Statistics for Engineering and th...StatisticsISBN:9781305251809Author:Jay L. DevorePublisher:Cengage Learning
 Statistics for The Behavioral Sciences (MindTap C...StatisticsISBN:9781305504912Author:Frederick J Gravetter, Larry B. WallnauPublisher:Cengage Learning
 Elementary Statistics: Picturing the World (7th E...StatisticsISBN:9780134683416Author:Ron Larson, Betsy FarberPublisher:PEARSON
 The Basic Practice of StatisticsStatisticsISBN:9781319042578Author:David S. Moore, William I. Notz, Michael A. FlignerPublisher:W. H. Freeman
 Introduction to the Practice of StatisticsStatisticsISBN:9781319013387Author:David S. Moore, George P. McCabe, Bruce A. CraigPublisher:W. H. Freeman