
Subpart (a):
The graphical illustration for the changes in
Subpart (a):
Explanation of Solution
Figure 1 shows the shift in the supply curve of labor force.
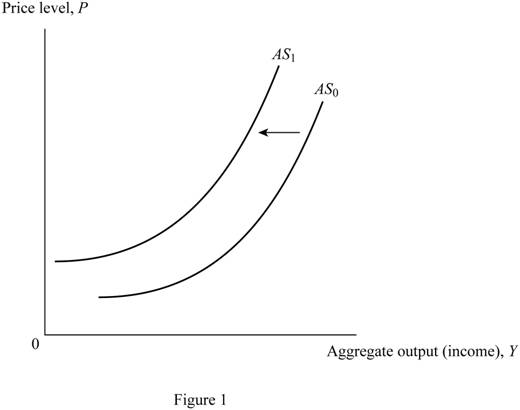
In Figure 1, the vertical axis measures the price level and the horizontal axis measures the aggregate output. The upward sloping curves AS0 and AS1 are aggregate supply curves. The decrease in the size of labor force reduces the supply of labor in the market. It shifts the
Concept introduction:
Aggregate Supply (AS): Aggregate supply refers to the total value of the goods and the services available for purchase at a particular price in a given period of time.
Subpart (b):
The graphical illustration for the changes in aggregate supply.
Subpart (b):
Explanation of Solution
Figure 2 shows the changes in the aggregate supply curve of capital.
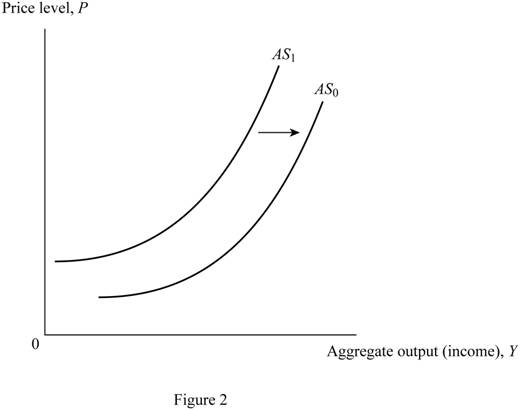
In Figure 2, the vertical axis measures the price level and the horizontal axis measures the aggregate output. The upward sloping curves AS0 and AS1 are aggregate supply curves. The increase in available capital increases the supply of capital in the market. It shifts the supply curve from AS1 to AS0.
Concept introduction:
Aggregate Supply (AS): Aggregate supply refers to the total value of the goods and services available for purchase at a particular price in a given period of time.
Subpart (c):
The graphical illustration for the changes in aggregate supply.
Subpart (c):
Explanation of Solution
Figure 3 shows the changes in aggregate supply curve.

In Figure 3, the vertical axis measures the price level and the horizontal axis measures the aggregate output. The upward sloping curves AS0 and AS1 are aggregate supply curves. An increase in the productivity, as a result of a technological change, shifts the aggregate supply curve to the right (from AS1 to AS0).
Concept introduction:
Aggregate Supply (AS): Aggregate supply refers to the total value of the goods and services available for purchase at a particular price in a given period of time.
Subpart (d):
The graphical illustration for the changes in aggregate supply curve.
Subpart (d):
Explanation of Solution
Figure 4 shows the changes in aggregate supply curve.

In Figure 4, the vertical axis measures the price level and the horizontal axis measures the aggregate output. The upward sloping curves AS0 and AS1 are aggregate supply curves. The increase in the price of oil increases the supply of oil in the market. It shifts the aggregate supply curve rightward (from AS1 to AS0).
Concept introduction:
Aggregate Supply (AS): Aggregate supply refers to the total value of the goods and services available for purchase at a particular price in a given period of time.
Want to see more full solutions like this?
Chapter 11 Solutions
Principles of Macroeconomics


 Principles of Economics (12th Edition)EconomicsISBN:9780134078779Author:Karl E. Case, Ray C. Fair, Sharon E. OsterPublisher:PEARSON
 Engineering Economy (17th Edition)EconomicsISBN:9780134870069Author:William G. Sullivan, Elin M. Wicks, C. Patrick KoellingPublisher:PEARSON
 Principles of Economics (MindTap Course List)EconomicsISBN:9781305585126Author:N. Gregory MankiwPublisher:Cengage Learning
 Managerial Economics: A Problem Solving ApproachEconomicsISBN:9781337106665Author:Luke M. Froeb, Brian T. McCann, Michael R. Ward, Mike ShorPublisher:Cengage Learning
 Managerial Economics & Business Strategy (Mcgraw-...EconomicsISBN:9781259290619Author:Michael Baye, Jeff PrincePublisher:McGraw-Hill Education