
Essentials of Business Analytics (MindTap Course List)
2nd Edition
ISBN: 9781305627734
Author: Jeffrey D. Camm, James J. Cochran, Michael J. Fry, Jeffrey W. Ohlmann, David R. Anderson
Publisher: Cengage Learning
expand_more
expand_more
format_list_bulleted
Concept explainers
Videos
Textbook Question
thumb_up100%
Chapter 11, Problem 16P
Consider the following network representation of a transportation problem:
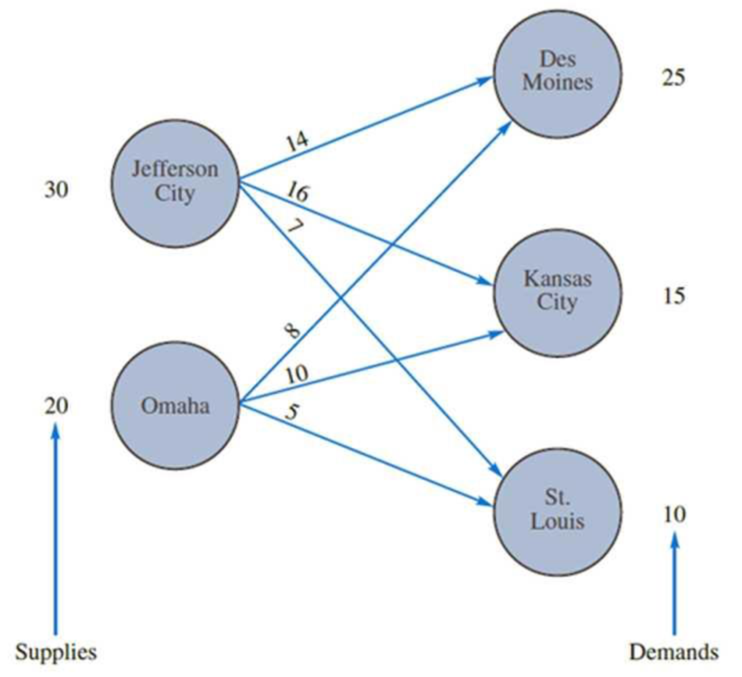
The supplies, demands, and transportation costs per unit are shown on the network. What is the optimal (cost minimizing) distribution plan?
Expert Solution & Answer
Want to see the full answer?
Check out a sample textbook solution
Students have asked these similar questions
The following table contains a list of activities, with precedence requirements and crash costs. All start and finish times and crash costs are on a per-week basis.
a. Draw the network diagram for the project below.
b What is the critical path and completion time for the project?
c. Determine the least expensive project cost if the duration is to be 10% shorter than normal project duration.
Activity
Normal Time
Crash Time
Normal Cost
Crash Cost
Predecessor
A
10
7
2,000
2,600
B
12
8
1,500
2,000
A
C
16
12
2,200
3,000
A
D
8
7
2,500
3,000
B
E
12
9
1,950
2,275
C
F
9
8
800
1,000
D
G
24
19
3,650
4,000
E, F
H
17
14
1,200
1,800
G
The accountant of Royal Products provided the following information for purposes of determining the optimal product mix: Product King (K) Product Queen (Q) Marginal income per unit R30 R36Machine hours required per unit 6 6Marginal income per machine hour R5 R6Ranking in terms of machine hours 2nd 1stLabour hours required per unit 3 6Marginal income per labour hour R10 R6Ranking in terms of labour hours 1st 2ndAnnual demand for product in units 12 000 15 000Labour hours available per annum 65 000 Machine hours available per annum 82 000 Required: Determine the optimal product mix by means of the application of linear programming techniques. (Hint: Start with your objective function and all necessary constraints.)
Jensen Tire & Auto is in the process of deciding whether to purchase a maintenance contract for its new computer wheel alignment and balancing machine. Managers feel that maintenance expense should be related to usage, and they collected the following information on weekly usage (hours) and annual maintenance expense (in hundreds of dollars).
Weekly Usage(hours)
AnnualMaintenance Expense
19
24
16
29
26
37
34
44
38
54
23
38
30
40
37
46
46
59
44
47
-select your answer choices-
b. p-value
less than 0.01
between 0.01 and 0.025
between 0.025 and 0.05
between 0.05 and 0.10
greater than 0.10
Conclusion
Do not conclude that there is a significant relationship between expense and weekly usage
Conclude that there is a significant relationship between expense and weekly usage
d.
No, the expected maintenance expense is less than $3000
Yes, the expected maintenance expense is greater than $3000
Chapter 11 Solutions
Essentials of Business Analytics (MindTap Course List)
Ch. 11 - Kelson Sporting Equipment, Inc., makes two types...Ch. 11 - The Sea Wharf Restaurant would like to determine...Ch. 11 - Blair Rosen. Inc. (BR) is a brokerage firm that...Ch. 11 - Round Tree Manor is a hotel that provides two...Ch. 11 - Industrial Designs has been awarded a contract to...Ch. 11 - Vollmer Manufacturing makes three components for...Ch. 11 - Photon Technologies, Inc., a manufacturer of...Ch. 11 - The Westchester Chamber of Commerce periodically...Ch. 11 - The management of Hartman Company is trying to...Ch. 11 - The employee credit union at State University is...
Ch. 11 - The Atlantic Seafood Company (ASC) is a buyer and...Ch. 11 - The Silver Star Bicycle Company will manufacture...Ch. 11 - The Clark County Sheriff’s Department schedules...Ch. 11 - Bay Oil produces two types of fuel (regular and...Ch. 11 - Consider the following network representation of a...Ch. 11 - Refer to the transportation problem described in...Ch. 11 - Aggie Power Generation supplies electrical power...Ch. 11 - The Calhoun Textile Mill is in the process of...Ch. 11 - Refer to the Calhoun Textile Mill production...
Knowledge Booster


Learn more about
Need a deep-dive on the concept behind this application? Look no further. Learn more about this topic, statistics and related others by exploring similar questions and additional content below.Similar questions
- Within a company is a (micro)economy that is monitored by the accounting procedures. In terms of the accounts, the various departments "produce" costs, some of which are internal and some of which are direct costs. This problem shows how an open Leontief model can be used to determine departmental costs. The sales department of an auto dealership charges 10% of its total monthly costs to the service department, and the service department charges 20% of its total monthly costs to the sales department. During a given month, the direct costs are $68,600 for sales and $29,400 for service. Find the total costs (in dollars) of each department. (Round your answers to the nearest whole number.)arrow_forwardAn industrial system has two industries with the following input requirements.arrow_forwardThe file MidCity Download MidCitycontains data on 128 recent sales in Mid City. For each sale, the file shows the neighborhood (1, 2, or 3) in which the house is located, the number of offers made on the house, the square footage, whether the house is made primarily of brick, the number of bathrooms, the number of bedrooms, and the selling price. Neighborhoods 1 and 2 are more traditional neighborhoods, whereas neighborhood 3 is a newer, more prestigious neighborhood. PROBLEM 1: Construct 3 different confidence intervals. Part A) Sort and filter the data from the MidCity file so that you only consider the data from neighborhood 1. Construct a 99% confidence interval for the square footage of all homes in neighborhood 1. Make sure you list the specific equations you are using, ALL variables, show ALL work etc., in your report. You can use Excel to complete all computations. Remember to interpret these confidence intervals in the context of this problem. Use one Excel spreadsheet…arrow_forward
- How common are financial cost or contractual constraints associated with smartphone ownership? A survey of smartphone owners found that 48% of the 18- to 29-year-olds, 38% of the 30- to 49-year-olds, 25% of the 50- to 64-year-olds, and 19% of those age 65 or older have reached the maximum amount of data they are allowed to use as part of their plan, at least on occasion. Suppose the survey was based on 200 smartphone owners in each of the four age groups: 18 to 29, 30 to 49, 50 to 64, and 65+. a. At the 0.05 level of significance, is there evidence of a differ-ence among the age groups in the proportion of smartphone owners who have reached the maximum amount of data they are allowed to use as part of their plan, at least on occasion? b. Determine the p-value in (a) and interpret its meaning. c. If appropriate, use the Marascuilo procedure and a=0.05 to determine which age groups differ.arrow_forwardFind the optimal levels of purchase x* and y*arrow_forwardHow common are financial cost or contractual constraints associated with smartphone ownership? A survey of smartphone users found that 48% of the 18- to29-year-olds, 39% of the 30- to 49-year-olds, 24% of the 50- to 64-year-olds, and 19% of those aged 65 or older have reached the maximum amount of data they are allowed to use as part of their plan, at least on occasion: Suppose the survey was based on 300 smartphone owners in each of the four age groups: 18 to 29, 30 to 49, 50 to 64, and 65 and older. Complete parts (a) through (c). a. At the 0.05 level of significance, is there evidence of a difference among the age groups in the proportion of smartphone owners who have reached the maximum amount of data they are allowed to use as part of their plan, at least on occasion? The test statistic is χ2STAT= (Round to three decimal places as needed.) I am struggling in finding the expected frequency can you show in detail how you accomplish this for each…arrow_forward
- the restaurant value stream map, and recompute the total value-added and non-value-added time and cost given the following new information. The chef's time is valued at $30 per hour, oven operation at $10 per hour, precooking order waiting time at $5 per hour, and postcooking order waiting time at $60 per hour. The $60 estimate reflects the cost of poor quality for a dinner waiting too long that might be delivered to the customer late (and cold). If a restaurant uses iPads to place orders and notify waiters when the customer's order is ready, the time on the order board (now an electronic order board) decreases from five to one minute, and the prepared order wait time decreases from five to four minutes. Round your answer for the total revised time to the nearest whole number and round your answer for the total revised cost to three decimal places. Total Revised Time: minutes Total Revised Cost: $arrow_forwardHow common are financial cost or contractual constraints associated with smartphone ownership? A survey of smartphone users found that 48% of the 18- to 29-year-olds, 39% of the 30- to 49-year-olds, 24% of the 50- to 64-year-olds, and 19% of those age 65 or older have reached the maximum amount of data they are allowed to use as part of their plan, at least on occasion: Suppose the survey was based on 300 smartphone owners in each of the four age groups: 18 to 29, 30 to 49, 50 to 64, and 65 and older. Complete parts (a) through (c). a. At the 0.05 level of significance, is there evidence of a difference among the age groups in the proportion of smartphone owners who have reached the maximum amount of data they are allowed to use as part of their plan, at least on occasion? Find the test statistic x 2 stat? and critcal valuearrow_forwardA distribution company is considering two locations for the construction of a new automated warehouse: Chicago and Dallas. Two types of automation are also being considered: bar coding and RF/ID (radio-frequency identification). The annual operating costs for each type of automation at the two locations are: Bar Coding RF/ID Location Fixed Cost Variable Cost per 1,000 units Fixed Cost Variable Cost per 1,000 units Chicago $1,800,000 $12.30 $2,700,000 $9.70 Dallas 1,500,000 13.10 2,300,000 9.40 For what range of annual product volume handled would each location and type of automation be preferred?arrow_forward
- J. D. Williams, Inc. is an investment advisory firm that manages more than $120 million in funds for its numerous clients. The company uses an asset allocation model that rec- ommends the portion of each client’s portfolio to be invested in a growth stock fund, an income fund, and a money market fund. To maintain diversity in each client’s portfolio, the firm places limits on the percentage of each portfolio that may be invested in each of the three funds. General guidelines indicate that the amount invested in the growth fund must be between 20% and 40% of the total portfolio value. Similar percentages for the other two funds stipulate that between 20% and 50% of the total portfolio value must be in the income fund and that at least 30% of the total portfolio value must be in the money market fund. In addition, the company attempts to assess the risk tolerance of each client and adjust the portfolio to meet the needs of the individual investor. For example, Williams just con- tracted…arrow_forwardHow common are financial cost or contractual constraints associated with smartphone ownership? A survey of smartphone users found that 49% of the 18- to 29-year-olds, 40% of the 30- to 49-year-olds, 25% of the 50- to 64-year-olds, and 19% of those age 65 or older have reached the maximum amount of data they are allowed to use as part of their plan, at least on occasion: Suppose the survey was based on 200 smartphone owners in each of the four age groups: 18 to 29, 30 to 49, 50 to 64, and 65 and older The critical value for this test is ? (round to three decimal points as needed)arrow_forwardHow common are financial cost or contractual constraints associated with smartphone ownership? A survey of smartphone users found that 49% of the 18- to 29-year-olds, 40% of the 30- to 49-year-olds, 25% of the 50- to 64-year-olds, and 19% of those age 65 or older have reached the maximum amount of data they are allowed to use as part of their plan, at least on occasion: Suppose the survey was based on 200 smartphone owners in each of the four age groups: 18 to 29, 30 to 49, 50 to 64, and 65 and older What is the p-value?arrow_forward
arrow_back_ios
SEE MORE QUESTIONS
arrow_forward_ios
Recommended textbooks for you
 MATLAB: An Introduction with ApplicationsStatisticsISBN:9781119256830Author:Amos GilatPublisher:John Wiley & Sons Inc
 Probability and Statistics for Engineering and th...StatisticsISBN:9781305251809Author:Jay L. DevorePublisher:Cengage Learning
 Statistics for The Behavioral Sciences (MindTap C...StatisticsISBN:9781305504912Author:Frederick J Gravetter, Larry B. WallnauPublisher:Cengage Learning
 Elementary Statistics: Picturing the World (7th E...StatisticsISBN:9780134683416Author:Ron Larson, Betsy FarberPublisher:PEARSON
 The Basic Practice of StatisticsStatisticsISBN:9781319042578Author:David S. Moore, William I. Notz, Michael A. FlignerPublisher:W. H. Freeman
 Introduction to the Practice of StatisticsStatisticsISBN:9781319013387Author:David S. Moore, George P. McCabe, Bruce A. CraigPublisher:W. H. Freeman
MATLAB: An Introduction with Applications
Statistics
ISBN:9781119256830
Author:Amos Gilat
Publisher:John Wiley & Sons Inc
Probability and Statistics for Engineering and th...
Statistics
ISBN:9781305251809
Author:Jay L. Devore
Publisher:Cengage Learning
Statistics for The Behavioral Sciences (MindTap C...
Statistics
ISBN:9781305504912
Author:Frederick J Gravetter, Larry B. Wallnau
Publisher:Cengage Learning
Elementary Statistics: Picturing the World (7th E...
Statistics
ISBN:9780134683416
Author:Ron Larson, Betsy Farber
Publisher:PEARSON
The Basic Practice of Statistics
Statistics
ISBN:9781319042578
Author:David S. Moore, William I. Notz, Michael A. Fligner
Publisher:W. H. Freeman
Introduction to the Practice of Statistics
Statistics
ISBN:9781319013387
Author:David S. Moore, George P. McCabe, Bruce A. Craig
Publisher:W. H. Freeman
The Shape of Data: Distributions: Crash Course Statistics #7; Author: CrashCourse;https://www.youtube.com/watch?v=bPFNxD3Yg6U;License: Standard YouTube License, CC-BY
Shape, Center, and Spread - Module 20.2 (Part 1); Author: Mrmathblog;https://www.youtube.com/watch?v=COaid7O_Gag;License: Standard YouTube License, CC-BY
Shape, Center and Spread; Author: Emily Murdock;https://www.youtube.com/watch?v=_YyW0DSCzpM;License: Standard Youtube License