
Videos
BASICS OF CAPITAL BUDGETING You recently went to work for Allied Components Company, a supplier of auto repair parts used in the after-market with products from Daimler AG, Ford, Toyota, and other automakers. Your boss, the chief financial officer (CFO), has just handed you the estimated cash flows for two proposed projects. Project L involves adding a new item to the firm’s ignition system line; it would take some time to build up the market for this product, so the
Here are the projects’ after-tax cash flows (in thousands of dollars):
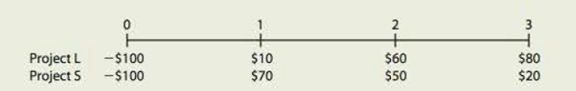
Depredation, salvage values, net operating working capital requirements, and tax effects are all included in these cash flows. The CFO also made subjective risk assessments of each project, and he concluded that both projects have risk characteristics that are similar to the firm’s average project Allied’s WACC is 10%. You must determine whether one or both of the projects should be accepted.
- a. What is capital budgeting? Are there any similarities between a firm’s capital budgeting decisions and an individual’s investment decisions?
- b. What is the difference between independent and mutually exclusive projects? Between projects with normal and nonnormal cash flows?
- c. 1. Define the term
net present value (NPV). What is each project’s NPV?2. What is the rationale behind the NPV method? According to NPV, which project(s) should be accepted if they are independent? Mutually exclusive?
3. Would the NPVs change if the WACC changed? Explain.
- d. 1. Define the term
internal rate of return (IRR). What is each project’s IRR?2. How is the IRR on a project related to the YTM on a bond?
3. What is the logic behind the IRR method? According to IRR, which project(s) should be accepted if they are independent? Mutually exclusive?
- 4. Would the projects’ IRRs change if the WACC changed?
- e. 1. Draw NPV profiles for Projects L and S. At what discount rate do the profiles cross?
2. Look at your NPV profile graph without referring to the actual NPVs and IRRs. Which project(s) should be accepted if they are independent? Mutually exclusive? Explain. Are your answers correct at any WACC less than 23.6%?
- f. 1. What is the underlying cause of ranking conflicts between NPV and IRR?
2. What is the reinvestment rate assumption, and how does it affect the NPV versus IRR conflict?
3. Which method is best? Why?
- g. 1. Define the term modified IRR (MIRR). Find the MIRKs for Projects L and S.
2. What are the MIRR’s advantages and disadvantages as compared to the NPV?
- h. 1. What is the payback period? Find the paybacks for Projects L and S.
2. What is the rationale for the payback method? According to the payback criterion, which project(s) should be accepted if the firm’s maximum acceptable payback is 2 years, if Projects L and S are independent? If Projects L and S are mutually exclusive?
3. What is the difference between the regular and discounted payback methods?
4. What are the two main disadvantages of discounted payback? Is the payback method useful in capital budgeting decisions? Explain.
- i. As a separate project (Project P), the firm is considering sponsoring a pavilion at the upcoming World’s Fair. The pavilion would cost $800,000, and it is expected to result in $5 million of incremental cash inflows during its 1 year of operation. However, it would then take another year, and $5 million of costs, to demolish the site and return it to its original condition. Thus, Project P’s expected cash flows (in millions of dollars) look like this:
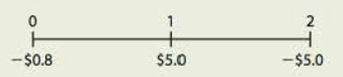
The project is estimated to be of average risk, so its WACC is 10%.
- 1. What is Project P’s NPV? What is its IRR? Its MIRR?
- 2. Draw Project P’s NPV profile. Does Project P have normal or nonnormal cash flows? Should this project be accepted? Explain.
- 1. What is Project P’s NPV? What is its IRR? Its MIRR?
a.
To explain: The concept of capital budgeting and whether there is any similarity between a firm’s capital budgeting decisions or individual investment decisions.
Capital Budgeting:
It refers to the long-term investment decisions that have been taken by the top management of a company and that are irreversible in nature. These decisions require an investment of a large amount of cash of the company.
Answer to Problem 24IC
- Capital budgeting can be referred to the long-term investment decisions that have been taken by the top management of a company and that are irreversible in nature. These decisions require an investment of a large amount of cash of the company.
- Capital budgeting is also an investment decision like any individual investment decision but the only difference is that it includes a greater amount of investment in comparison to individual’s investment.
Explanation of Solution
- Capital budgeting is the long-term investment decisions which includes a great amount of investment and that are irreversible in nature, unlike an individual’s investment decision.
- Capital budgeting and individual’s investment are similar in all the aspects but they differ in the amount to be invested or the size of the project or investment.
Thus, capital budgeting is also an investment decision like individual’s investment decision but greater in size than that.
b.
To explain: The difference between mutually exclusive and independent projects and between normal and nonnormal cash flow projects.
Answer to Problem 24IC
- The difference between the mutually exclusive projects and independent projects is that in case of the mutually exclusive project the acceptance or rejection of a project affects the decision regarding acceptance or rejection of the other project which is not there in case of independent projects.
- The difference between the normal and nonnormal cash flow projects is that in case of normal cash flows there are only one or two cash outflows at the beginning of the project and after that only cash inflows would be there which is not there in case of nonnormal cash flow project.
Explanation of Solution
- Mutually exclusive projects are those in which acceptance or rejection of one project will automatically lead to a decision regarding another project while in case of independent project acceptance or rejection of one project will not lead to a decision regarding another project.
- In case of mutually exclusive projects, only one project can be selected while in case of independent projects more than one project can be selected.
- Normal cash flows projects are those in which there are one or two cash outflows at the beginning of the project and after that only cash inflows arrive while in cash of nonnormal cash flow projects cash outflow can occur in the middle of the life of the project.
- Normal cash flow projects include the series of cash inflows while in case of nonnormal cash flow project there is no such series.
Thus, there is a huge difference between mutually exclusive and independent project and between normal and nonnormal cash flow projects.
c.
1.
To explain: The concept of NPV and calculation of NPV of each project.
Net Present Value (NPV):
It is a method under capital budgeting which includes the computation of the net present value of the project in which company is investing. The calculation is done by calculating the difference between the value of cash inflow and value of cash outflow after taking into consideration the discounted rate.
Explanation of Solution
NPV refers to the method under capital budgeting which includes the calculation of the net present value of the project in which company is investing. The calculation is done by calculating the difference between the value of cash inflow and value of cash outflow after taking into consideration the discounted rate.
Project L
Given,
Cost of the project is $100 thousand dollars.
Cash inflow at the end of the 1st year is $10 thousand dollar.
Cash inflow at the end of the 2nd year is $60 thousand dollar.
Cash inflow at the end of the 3rd year is $80 thousand dollar.
Life of the project is 3 years.
WACC of the project is 10%.
Calculation of NPV for project L on the spreadsheet is,
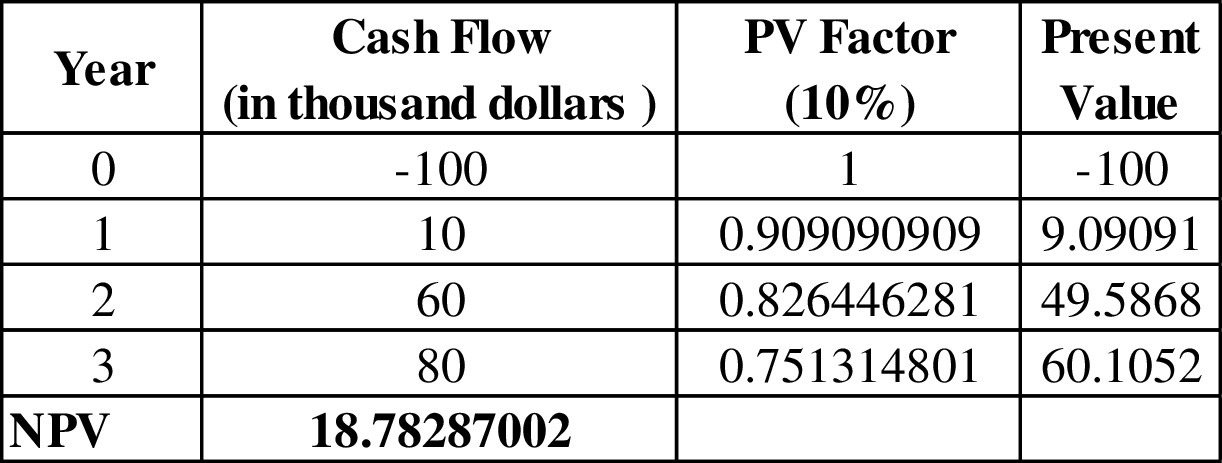
Table (1)
The NPV of project L is $18.78 thousand dollars.
Project S
Given,
Cost of the project is $100 thousand dollars.
Cash inflow at the end of the 1st year is $70 thousand dollar.
Cash inflow at the end of the 2nd year is $50 thousand dollar.
Cash inflow at the end of the 3rd year is $20 thousand dollar.
Life of the project is 3 years.
WACC of the project is 10%.
Calculation of NPV for project S on the spreadsheet is,
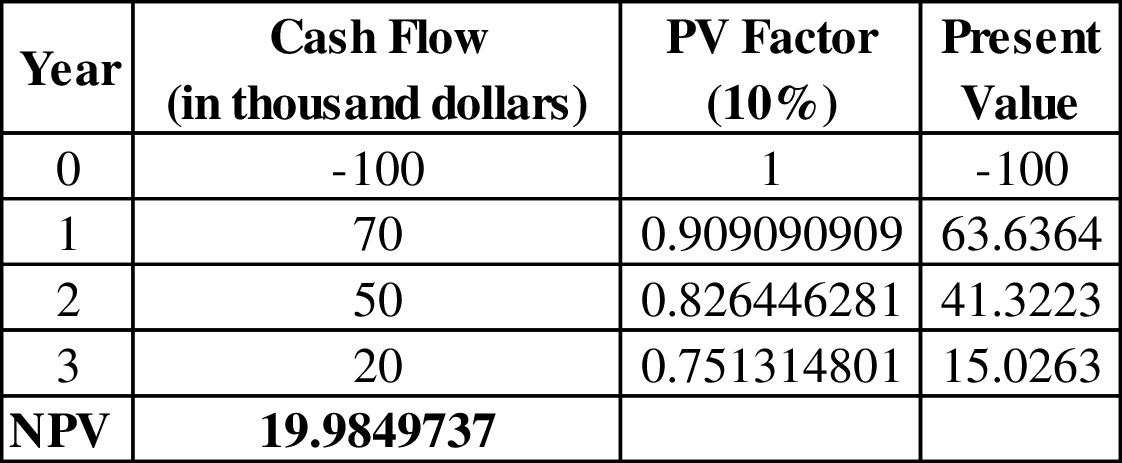
Table (2)
The NPV of project S is $19.98 thousand dollars.
- NPV can be defined as the method for decision making related to capital budgeting investment decisions. It is a method that provides the profit to be generated by the project after considering the time value of money.
- The rule under NPV method for decision making is higher the NPV, the higher would be the profit from the project would be.
- In NPV method a project is accepted when NPV is greater than 0 and it is rejected when it is less than 0 and at 0 NPV the project may or may not be selected.
Thus, NPV of project L is $18.78 thousand dollars and NPV of project S is $19.98 thousand dollars.
2.
To explain: The rationale behind NPV method and whether project L or S should be selected if they independent and when they are mutually exclusive.
Answer to Problem 24IC
The rationale behind NPV is that the 0 NPV of a project implies that the project is generating exact amount that the company is needed to pay for the project as debt and NPV greater than 0 shows that the company is generating profit after paying for its debt of the project while NPV less than 0 shows that project would not be able to generate the amount even to pay for its debt.
If the projects are independent then the company should accept both the projects as both are having NPV greater than 0.
If projects are mutually exclusive than the company should accept project S over project L as project S is having higher NPV than project L.
Explanation of Solution
- Since in case of independent projects, multiple projects can be selected at a time, and both projects are having positive NPV, both projects can be accepted as they are independent.
- Since in case of the mutually exclusive project only one project can be selected and projects S has higher NPV than project L, project S is better than project L and it should be accepted over project L.
Thus, if the projects are independent than a project with highest positive NPVcan be accepted and if the projects are mutually exclusive than project S should be accepted over project L.
3.
To explain: Whether the NPV changes with the change in WACC.
Answer to Problem 24IC
Yes, the NPV changes with the change in WACC.
Explanation of Solution
- The NPV is totally dependent on the value of the WACC as NPV considers the discounted cash flows instead of normal cash flows.
- The NPV of a project and WACC has a direct relationship with each other which means an increase in WACC would increase the value of NPV of the project and vice versa.
Thus, the NPV changes with the change in WACC.
d.
1.
To explain: The concept of IRR and calculation of IRR of each project.
Internal Rate of Return (IRR):
It refers to the rate of return that is computed by the company to make a decision of selection of a project for investment. This rate provides the basis for selection of projects with a lower cost of capital and rejection of project with a higher cost of capital.
Explanation of Solution
IRR refers to the rate of return that is computed by the company to make a decision of selection of a project for investment. This rate provides the basis for selection of projects with a lower cost of capital and rejection of project with a higher cost of capital.
Project L
Given,
Cost of the project is $100 thousand dollars.
Cash inflow at the end of the 1st year is $10 thousand dollar.
Cash inflow at the end of the 2nd year is $60 thousand dollar.
Cash inflow at the end of the 3rd year is $80 thousand dollar.
Life of the project is 3 years.
WACC of the project is 10%.
Calculation of IRR for project L on the spreadsheet is:
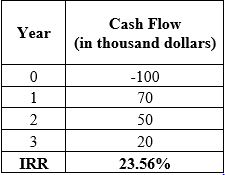
Table (3)
The IRR of project L is 18.13%.
Project S
Given,
Cost of the project is $100 thousand dollars.
Cash inflow at the end of the 1st year is $70 thousand dollar.
Cash inflow at the end of the 2nd year is $50 thousand dollar.
Cash inflow at the end of the 3rd year is $20 thousand dollar.
Life of the project is 3 years.
WACC of the project is 10%.
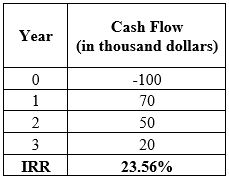
Table (4)
The IRR of project S is 23.56%.
- IRR can be defined as the rate of return that is to be achieved from the project by the end of the life of the project.
- It is that rate of return at which NPV stands 0 which means this is the minimum rate of return that a company should get from a project after accepting it.
Thus, IRR of project L is 18.13% and IRR of project S is 23.56%.
2.
To explain: The relationship of IRR on a project to the YTM on a bond.
Answer to Problem 24IC
The relationship of IRR on a project is same as the relationship of YTM that is yield to maturity on a bond as both provides the minimum rate of return that the investment should provide after accepting the project or bond.
Explanation of Solution
- YTM is the minimum rate of return that a bond should provide after investing in it below which the investment would incur loss instead of profit as in the case of IRR at which NPV stands 0.
- IRR is the expected rate of return on a project while the YTM is promised a rate of return on the bond.
Thus, the relationship of IRR on a project is same as the relationship of YTM that is yield to maturity on a bond.
3.
To explain: The logic behind the IRR method and whether the project L or S should be selected when they are an independent project and when they are mutually exclusive projects.
Answer to Problem 24IC
The logic to calculate IRR is to know the project’s rate of return and to know whether the project is generating economic profit or an economic loss.
If the projects are independent then both projects can be accepted as both provide IRR greater than the cost of capital.
If the projects are mutually exclusive then project S should be accepted over project L as the IRR of project S is higher than project L.
Explanation of Solution
- Since in case of independent projects, multiple projects can be selected at a time, and both projects are having IRR greater than the cost of capital both projects should be accepted.
- Since in case of the mutually exclusive project, only one project can be selected and projects have higher IRR than project L, project S is better than project L and it should be accepted over project L.
Thus, both projects must be selected when they are independent and project S should be accepted over project L when they are mutually exclusive projects.
4.
To explain: Whether the project IRR change with the change in WACC.
Answer to Problem 24IC
No, the project’s IRR does not get changed with the change in WACC.
Explanation of Solution
- The IRR of a project is independent of WACC as it does not consider the cash flows after discounting them, so WACC has no impact on IRR.
- The IRR of a project remains same for a project at the different level of WACC.
Thus, IRR does not change with the change in WACC.
e.
1.
To construct: NPV profile for both the projects and crossover rate.
Crossover Rate:
It refers to that discounted rate at which the NPV of the two projects becomes equal. It is a cost of capital of the project.
Explanation of Solution
The NPV profile of project L and project S is:
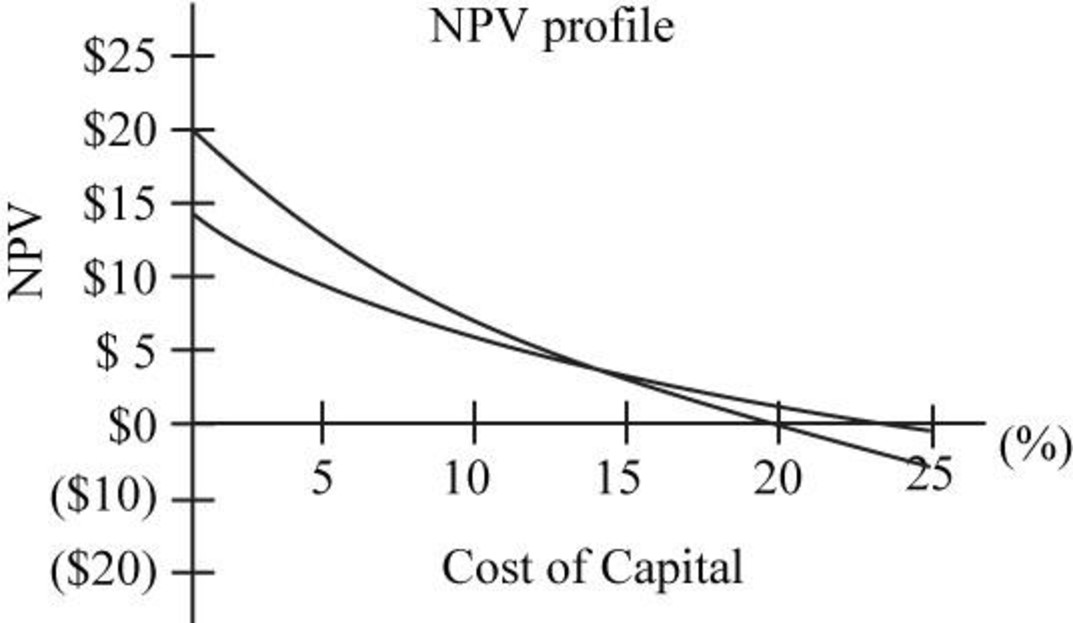
Fig.1
In the above figure, NP profile of project L is given by the blue line and of project S is given by black line.
- In the above figure, it can be seen that NPV of project L is decreasing much faster than project S with the increase in WACC.
- From the above figure, it can be seen that the NPV of both the project stands equal to approximately 9% WACC, so the crossover rate is 9%.
Thus, the crossover rate of the two projects is 9%.
2.
To explain: Whether to accept project A or project B on the basis of NPV profile when they are independent or when they are mutually exclusive.
Answer to Problem 24IC
- When projects are independent then both projects can be selected when WACC is less than 18% and only project S should be accepted when it is between 18 to 24%.
- When the projects are mutually exclusive then project L should be chosen over project S when WACC is less than crossover rate and when it is greater than crossover rate project S should be chosen over project L.
Explanation of Solution
- From the above figure it can be seen that NPV of project L is positive when the WACC is less than 18% and NPV of project S is positive when WACC is less than 24%, so when the projects are independent both projects can be accepted when WACC is less than 18% and only project S should be accepted when it is between 18 to 24%
- From the above figure it can be seen that the NPV of project L is higher when the WACC is less than the crossover rate and after that NPV of project S is higher, so, when the projects are mutually exclusive the project L should be accepted when WACC is less than the crossover rate and project S should be accepted when WACC is between crossover rate and 24%
Thus, on the basis of NPV profile, the selection of projects totally depends upon the rate of WACC whether they are independent or mutually exclusive.
f.
1.
To explain: The underlying cause of ranking conflicts between IRR and NPV.
Answer to Problem 24IC
The major cause of ranking conflict between IRR and NPV is that they have different assumptions for reinvestment rate of cash flows. There are other few reasons too which are:
- Difference between the size of the projects, which have a direct effect on NPV of the project but might not have any effect on IRR.
- The difference in the timing of the projects which is considered in NPV but not in IRR.
Explanation of Solution
- Since NPV assumes the reinvestment rate as the cost of capital of the project while IRR considers the reinvestment at IRR; it is the major cause of conflict between the ranking between the NPV and IRR.
- Since NPV is affected by the size of the project, the greater the size of the project the greater would be the NPV which is not there in case of IRR, this also creates the conflict between NPV and IRR.
- Since NPV considers the time value of money, so it gets affected with the increase in time of the project which is not there in case of IRR, so this also creates the conflict between IRR and NPV.
Thus, in case of mutually exclusive projects, there can be a conflict between the rankings of IRR and NPV.
2.
To explain: the reinvestment rate assumption and the way it affects the NPV versus IRR conflicts.
Answer to Problem 24IC
Reinvestment rate assumption is referred to the assumption related to the discounting or compounding the cash flows generated through a project.
It increases the conflict between the NPV and IRR due to the difference in the assumption regarding reinvestment rate.
Explanation of Solution
- In case of NPV, the discounting of the cash flows is done on the cost of capital, so it considers the reinvestment of cash flows at the cost of capital.
- In case of IRR, the compounding of the cash flows is done on the IRR, so it assumes the reinvestment of cash flows at the IRR.
- This difference in assumption increases the conflict between IRR and NPV.
Thus, the assumption regarding reinvestment rate increases the conflict between IRR and NPV.
3.
To explain: Whether the NPV or IRR is a better method.
Answer to Problem 24IC
NPV is a better method than IRR.
Explanation of Solution
- Since NPV assumes the reinvestment at cost of capital which is more logical and appropriate than IRR; it is a better method than IRR for an investment decision.
- Since NPV also considers the shareholders’ wealth which is not there in case of IRR, so, NPV is better than IRR.
- There is a uniquesolution in case of NPV for each project at different WACC while IRR can have multiple solutions.
Thus, NPV is a better method than IRR.
g.
1.
To explain: The concept of MIRR and calculation of MIRR for given projects.
Modified Internal Rate of Return (MIRR):
It refers to the rate of return that is computed by the company to make a decision of selection and ranking of a project for investment. This is a modified version of IRR with reinvestment of cash flows at the cost of capital.
Explanation of Solution
MIRR refers to the rate of return that is computed by the company to make a decision of selection and ranking of a project for investment. This is a modified version of IRR with reinvestment of cash flows at the cost of capital.
Project L
Given,
Cost of the project is $100 thousand dollars.
Cash inflow at the end of the 1st year is $10 thousand dollar.
Cash inflow at the end of the 2nd year is $60 thousand dollar.
Cash inflow at the end of the 3rd year is $80 thousand dollar.
Life of the project is 3 years.
WACC of the project is 10%.
Calculation of IRR for project L on the spreadsheet is:
Table (5)
The MIRR of project L is 16.50%.
Project S
Given,
Cost of the project is $100 thousand dollars.
Cash inflow at the end of the 1st year is $70 thousand dollar.
Cash inflow at the end of the 2nd year is $50 thousand dollar.
Cash inflow at the end of the 3rd year is $20 thousand dollar.
Life of the project is 3 years.
WACC of the project is 10%.
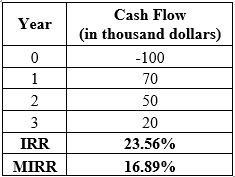
Table (6)
The MIRR of project S is 16.89%.
- The MIRR can be defined as the rate of return which is expected by the company to be earned at the end of the life of the project.
- It is a modified version of IRR which assumes the reinvestment at cost of capital in spite of IRR.
Thus, the MIRR of project L is 16.50% and of project, S is 16.89%.
2.
To explain: The advantages and disadvantages of MIRR as compared to NPV.
Answer to Problem 24IC
The advantages of MIRR as compared to NPV are:
- It can provide a higher value for a project which has low NPV with the same cost of capital.
- It includes the future value of cash flow that is to be expected in spite of the present value of future cash flow as in case of NPV.
The disadvantages of MIRR as compared to NPV are:
- It does not consider the shareholders’ wealth as in the case of NPV.
- It can provide multiple solutions for one project.
Explanation of Solution
- MIRR is the modified rate of return which includes the calculation of the future values of the given cash flow which is not there in case of NPV.
- MIRR can provide a greater ranking to the project which has such low NPV.
- MIRR does not consider the shareholders’ wealth as in case of NPV which is a major disadvantage of MIRR.
- Unlike NPV, MIRR can have multiple solutions of a project which does not provide accurate decision making.
Thus, in spite of advantages, as compared to NPV, MIRR is still not that good as NPV.
h.
1.
To explain: The concept of payback period and calculation of payback period for the given projects.
Payback Period:
It refers to the time period that is required to get an amount invested in a project with some return on it. In other words, it is the time that a project takes to repay the amount invested with some return attached to it.
Discounted Payback Period:
It refers to the time period that a project takes to repay the amount invested with some returns attached to it after considering the time value of money or discounted cash flows.
Explanation of Solution
Payback period refers to the time period that is required to get an amount invested in a project with some return on it. In other words, it is the time that a project takes to repay the amount invested with some return attached to it.
Project L
Given,
Cost of the project is $100 thousand dollars.
Cash inflow at the end of the 1st year is $10 thousand dollar.
Cash inflow at the end of the 2nd year is $60 thousand dollar.
Cash inflow at the end of the 3rd year is $80 thousand dollar.
Life of the project is 3 years.
WACC of the project is 10%.
The formula to calculate payback period is,
Substitute 2 for the year of last negative cumulative cash flow,
The payback period of the project L is 2.375 years.
Working note:
Calculation of cumulative cash flow,

Table (7)
Project S
Given,
Cost of the project is $100 thousand dollars.
Cash inflow at the end of the 1st year is $70 thousand dollar.
Cash inflow at the end of the 2nd year is $50 thousand dollar.
Cash inflow at the end of the 3rd year is $20 thousand dollar.
Life of the project is 3 years.
WACC of the project is 10%.
Substitute 1 for the year of last negative cumulative cash flow,
The payback period for the project S is 1.6 years.
Working note:
Calculation of cumulative cash flow,
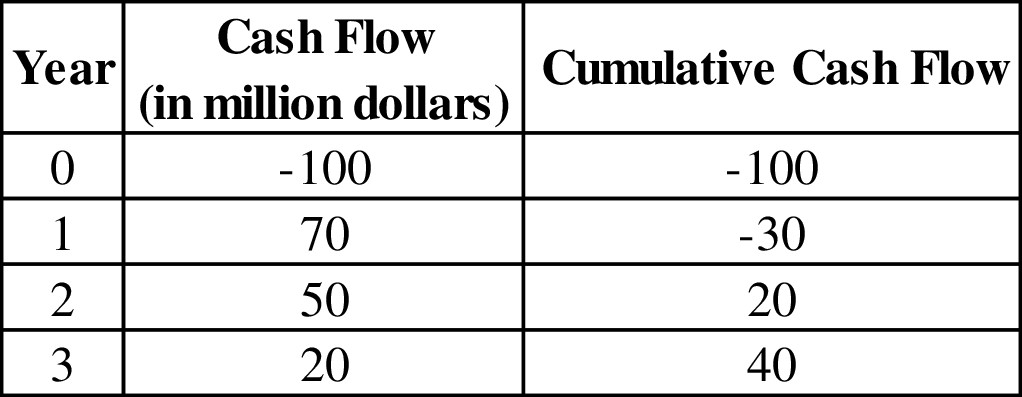
Table (8)
- The payback period can be defined as the period after which the return can be expected.
- It does not consider the time value of money, so normal cash flows are considered in the calculation in spite of discounted cash flows.
Thus, the payback period of project L is 2.375 years and project S is 1.6 years.
2.
To explain: The rationale behind the payback period and whether to accept project L or S when the payback period is 2 years when they are independent and when they are mutually exclusive.
Explanation of Solution
The rationale behind the payback period is that when the payback period of the project is lesser than the company decided payback period, it is accepted and when it is greater than the company decided payback period, it is rejected.
When the payback period is 2 years and projects are independent, then project S should be chosen as the payback period of project S is lesser than 2 years.
When the payback period is 2 years and projects are mutually exclusive, then project S should be chosen as the payback period of project S is lesser than 2 years.
- In case of independent projects multiple projects can be chosen at a time but as only project, S has lesser time period than 2 years, so only project S would be selected.
- In case of mutually exclusive projects one project can be selected at a time and since project S has lesser time period than 2 years, so only project S would be selected.
Thus, project S should be chosen over project L on the basis of payback period whether the projects are independent or mutually exclusive.
3.
To explain: The difference between regular payback period and discounted payback period.
Answer to Problem 24IC
The only difference between the payback period and the discounted payback period is that the payback period does not consider the time value of money while the discounted payback period assumes the time value of money.
Explanation of Solution
- The payback period is the period after which the return on investment is expected by the company on the normal cash flows while the discounted payback period is the period after which the return on investment is expected on discounted cash flows.
- Payback period does not consider the time value of money while discounted payback period considers the time value of money.
Thus, the difference between the payback period and the discounted payback period is the treatment of time value of money.
4.
To explain: The two disadvantages of discounted payback period and whether payback period is useful in capital budgeting.
Answer to Problem 24IC
The two disadvantages of discounted payback period are:
- It does not consider the cash flow after the payback period.
- It does not take into consideration the shareholders’ wealth.
Payback period is not much use for the company for capital budgeting decision.
Explanation of Solution
- Discounted payback period does contemplate the time value of money but it does consider the amount of cash flow generated after the payback period which is its major disadvantage.
- Discounted payback period does not consider the shareholders’ wealth which is there isa case of NPV. So, the discounted payback period is not much use for a company to make capital budgeting decisions but it is still calculated to have estimated time period for return.
Thus, the payback period is not a much useful method for capital budgeting decisions.
i.
1.
To calculate: The NPV, IRR, and MIRR of project P.
Explanation of Solution
Given information:
Cost of the project is $0.8 million dollars.
Cash inflow at the end of the 1st year is $5.0 million dollars.
Cash outflow at the end of the 2nd year is $5.0 million dollars.
Life of the project is 2 years.
Cost of capital is 10%.
Calculation of NPV, IRR,and MIRR of project P on the spreadsheet is,
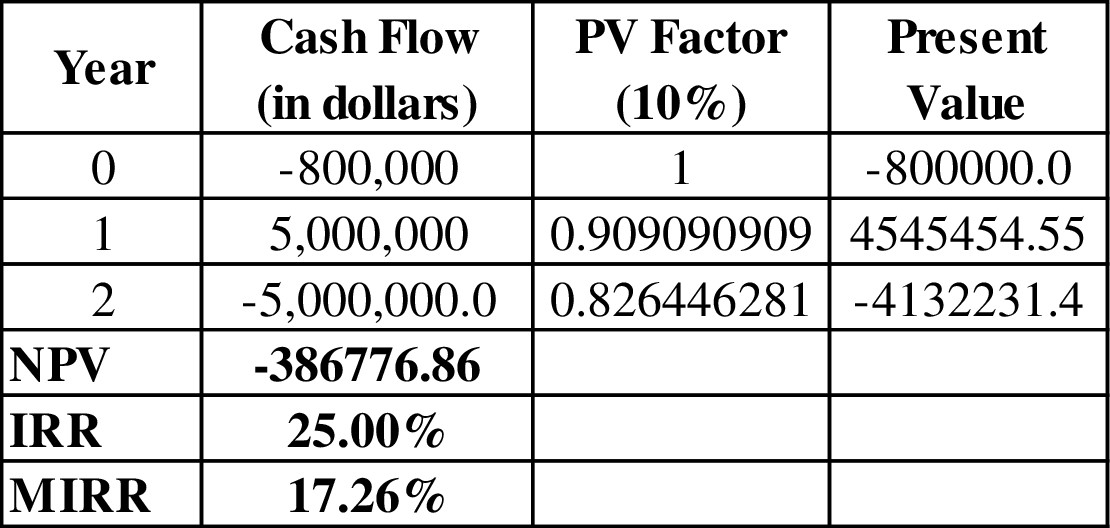
Table (9)
The NPV, IRR, and MIRR of project P are-386,776.86 dollars, 25%, 17.26% respectively.
Thus, the NPV, IRR, and MIRR of project P are-386,776.86 dollars, 25%, and 17.26% respectively.
2.
To explain: Whether the project p has normal or nonnormal cash flows and whether the project P should be accepted or not and construct NPV profile for project P.
Answer to Problem 24IC
The NPV profile of project P is:
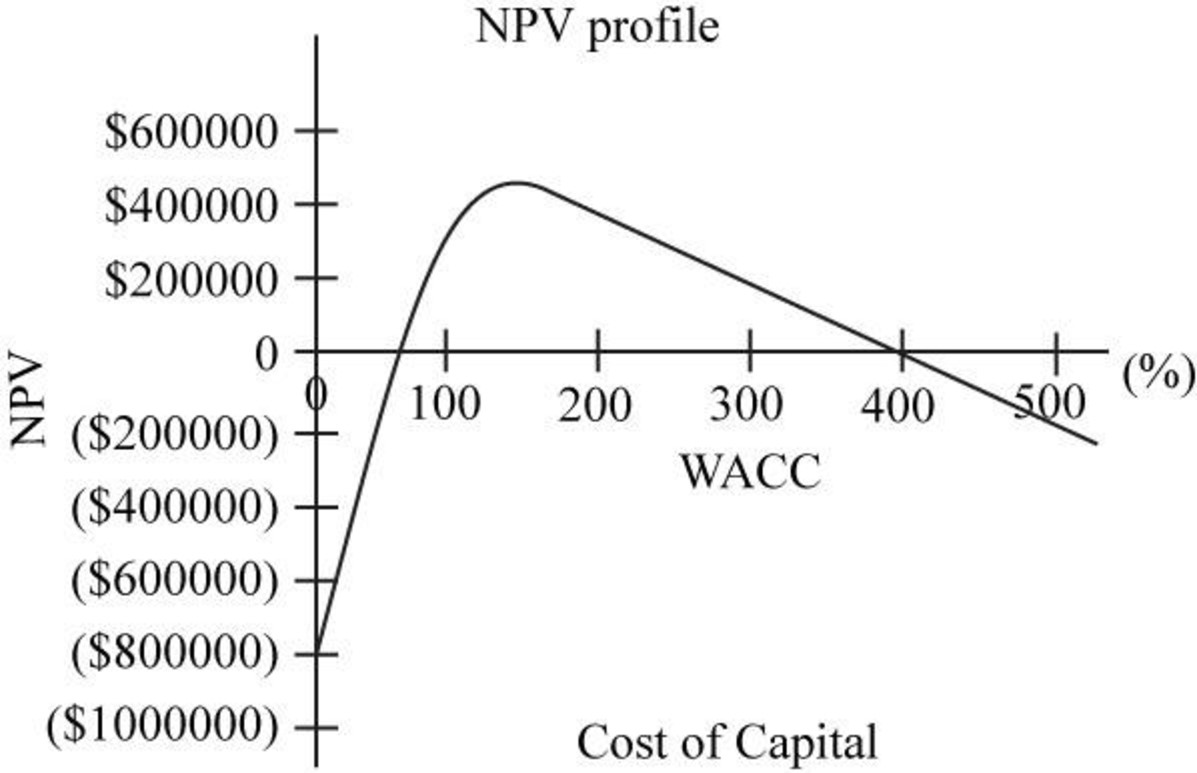
Fig.2
The project P has nonnormal cash flows.
The project P should not be accepted.
Explanation of Solution
From the above figure it can be seen that project with WACC less than 50% provides negative NPV and after 50% of WACC, it provides positive NPV.
Since the project P does not have the series of cash inflow; it provides non-normal cash flows in which there is no series of positive cash inflow.
Since the NPV of project P at 10% WACC is negative, so it should not be accepted by the company.
Thus, the project P has non-normal cash flow and it should not be accepted.
Want to see more full solutions like this?
Chapter 11 Solutions
Fundamentals of Financial Management, Concise Edition (with Thomson ONE - Business School Edition, 1 term (6 months) Printed Access Card) (MindTap Course List)


- Review of Basic Capital Budgeting Procedures Dr. Whitley Avard, a plastic surgeon, had just returned from a conference in which she learned of a new surgical procedure for removing wrinkles around eyes, reducing the time to perform the normal procedure by 50%. Given her patient-load pressures. Dr. Avard is excited to try out the new technique. By decreasing the time spent on eye treatments or procedures, she can increase her total revenues by performing more services within a work period. In order to implement the new procedure, special equipment costing 74,000 is needed. The equipment has an expected life of 4 years, with a salvage value of 6,000. Dr. Avard estimates that her cash revenues will increase by the following amounts: She also expects additional cash expenses amounting to 3,000 per year. The cost of capital is 12%. Assume that there are no income taxes. Required: 1. Compute the payback period for the new equipment. 2. Compute the ARR. Round the percentage to two decimal places. 3. CONCEPTUAL CONNECTION Compute the NPV and IRR for the project. Use 14% as your first guess for IRR. Should Dr. Avard purchase the new equipment? Should she be concerned about payback or the ARR in making this decision? 4. CONCEPTUAL CONNECTION Before finalizing her decision. Dr. Avard decided to call two plastic surgeons who have been using the new procedure for the past 6 months. The conversations revealed a somewhat less glowing report than she received at the conference. The new procedure reduced the time required by about 25% rather than the advertised 50%. Dr. Avard estimated that the net operating cash flows of the procedure would be cut by one-third because of the extra time and cost involved (salvage value would be unaffected). Using this information, recompute the NPV of the project. What would you now recommend?arrow_forwardCapital budgeting Mrs. Alis is an intelligent business woman. She makes her investments after a very thoughtful process. In January 2018 , her manager has shown her some projects with the following details Option A Investment into a towel business that initially cost $200,000 and then will generate cash inflow of $24000 per year for the next 10 years Option B Investment into a detergent business that initially cost $190,000 and then will generate cash inflow of $20,000 for each of next 12 years. The rate of return associated with both the investments is 12%. Calculate net present value (NPV) and internal rate of return (IRR) of both the investments. Comment on which investment Mrs Alis should pick on the basis NPV and IRR.arrow_forwardCase Study: Your company needs to take another capital budgeting consideration regardingexpansion of seafood product market. Your Financial Team was assigned the job to evaluate thepotential risks of a new project. In the new project, the company will launch a new product line thatis expected to boost the sales by 10%. The new project is expected to generate an annual sale of3,500,000 units for an average price of $3.50 per unit for 5 years. The new investment projectrequires your company to buy a new assembly line with initial cost of $1,250,000, a residual valueof $250,000 at the end of the project. The company will need to add $160,000 in working capitalwhich is expected to be fully retrieved at the end of the project. Other information is availablebelow:Depreciation method: straight lineVariable cost per unit: $1.2Cash fixed costs per year: $50,000Corporate marginal tax: 30%Discount rate:11%Your Finance Department conducted some economics forecast and estimated that in the…arrow_forward
- Capital Budgeting Case You are a senior financial analyst at PALTEL and you are requested to analyse the following project, where all of the dollar figures are in thousands of dollars. In year 0, the project requires an $11,350 investment in plant and equipment which is depreciated using the straight-line method over seven years and has a salvage value of $1,400 in year 7. The project is forecast to generate sales of 2,000 units in year 1, rising to 7,400 units in year 5, declining to 1,800 units in year 7. The inflation rate is forecast to be 2.0% in year 1, rising to 4.0% in year 5, and then levelling off. The real cost of capital is forecasted to be 11.0% in year 1, rising to 12.2% in year 7. The tax rate is constant at 35%. Sales revenue per unit is forecasted to be $9.70 in year 1 and then grow with inflation. The variable unit cost for Direct Labour, Materials, Selling Expenses, and overhead are forecasted to be $3.50, $2.00, $1.20, and $0.70, respectively, in year 1 and then…arrow_forwardCAPITAL BUDGETING DECISION CRITERIA(a) Big Pineapple, a maker of swizzle sticks, is considering the purchase of a new plastic stamping machine. This investment requires an initial outlay of RM40,000 and will generate free cash inflows of RM7,000 in years 1 through 5, RM8,000 in year 6, RM10,000 in year 7, RM15,000 in year 8, RM10,000 in year 9 and RM4,000. If the required rate of return is 10 percent;1. Calculate the Payback Period?2. Calculate the Net Present Value (NPV)?(b)Honeydew Sdn. Bhd has been presented with an opportunity to invest in a project. Investment Required is RM60,000,000, Annual Gross Income is RM14,000,000, Annual Operating Costs is RM5,500,000 and nil for Salvage Value after 10 years. The project is expected to operate as shown for ten years. If your management expects to make 10% on its investment before taxes. Calculate the Internal Rate of Return (IRR) for this project and would you recommend Honeydew Sdn. Bhd this project? Explain.(c)Many acts such as…arrow_forwardPart 2 Please study the following capital budgeting project and then provide explanations for the questions outlined below: You have been hired as a consultant for Pristine Urban-Tech Zither, Inc. (PUTZ), manufacturers of fine zithers. The market for zithers is growing quickly. The company bought some land three years ago for $2.1 million in anticipation of using it as a toxic waste dump site but has recently hired another company to handle all toxic materials. Based on a recent appraisal, the company believes it could sell the land for $2.3 million on an after-tax basis. In four years, the land could be sold for $2.4 million after taxes. The company also hired a marketing firm to analyze the zither market, at a cost of $125,000. An excerpt of the marketing report is as follows: The zither industry will have a rapid expansion in the next four years. With the brand name recognition that PUTZ brings to bear, we feel that the company will be able to sell 3,600, 4,300, 5,200, and 3,900…arrow_forward
- CAPITAL BUDGETING AND CASH FLOW ESTIMATION Allied Food Products is considering expanding into the fruit juice business with a new fresh lemon juice product. Assume that you were recently hired as assistant to the director of capital budgeting, and you must evaluate the new project. The lemon juice would be produced in an unused building adjacent to Allied’s Fort Myers plant; Allied owns the building, which is fully depreciated. The purchase price of the required equipment is $280,000, including shipping and installation costs, and the equipment is eligible for 100% bonus depreciation at the time of purchase. In addition, inventories would rise by $25,000, while accounts payable would increase by $5,000. All of these costs would be incurred at t = 0. The project is expected to operate for 4 years, at which time it will be terminated. The cash inflows are assumed to begin 1 year after the project is undertaken, or at t = 1, and to continue out to t = 4. At the end of the project’s life…arrow_forwardWorking capital and capital budgeting. Farbuck's Tea Shops is thinking about opening another tea shop. The incremental cash flow (not including the working capital investment) for the first five years is as follows: Initial capital cost=$3,500,000 Operating cash flow for each year=$1,000,000 Recovery of capital assets after five years=$260,000 The hurdle rate for this project is 12%. If the initial cost of working capital is $490,000 for items such as teapots, teacups, saucers, and napkins, should Farbuck's open this new shop if it will be in business for only five years? What is the most it can invest in working capital and still have a positive net present value? Should Farbuck's open this new shop if it will be in business for only five years? (Select the best response.) A.Yes. Farbuck's should open the new shop because the project's NPV is $40,346. B.No. Farbuck's should not open the new shop because the project's NPV is…arrow_forward“Capital Budgeting†Simulation and Mini-CaseNote: This is an application of capital budgeting that integrates the projection of a basic cash flow and the computation and analysis of six capital budgeting tools.Your company is thinking about acquiring another corporation. You have two choices; the cost of each choice is $250,000. You cannot spend more than that, so acquiring both corporations is not an option. The following are your critical data:Corporation A:Revenues = 100K in year one, increasing by 10% each year.Expenses = 20K in year one, increasing by 15% each year.Depreciation Expense = 5K each year.Tax Rate = 25%Discount Rate = 10%Corporation B:Revenues = 150K in year one, increasing by 8% each year.Expenses = 60K in year one, increasing by 10% each year.Depreciation Expense = 10K each year.Tax Rate = 25%Discount Rate = 11%You must compute and analyze items (a) through (h) using a Microsoft Excel spreadsheet. Make sure that all calculations can…arrow_forward
- Capital Budgeting – Kogan.com Ltd. All amounts are in $AUD. In order to satisfy the sharp increase in demand KGN is evaluating investing in a “Mega Warehouse” project in Australia. KGN has already identified two existing warehouses. In order to mitigate the risk and assess the fit for purpose of these facilities KGN asked “Axiom Ltd.” to conduct a technical due diligence. “Axiom Ltd.” is asking $100,000 as a fixed fee for its consulting services. Project A has an initial outlay of dollars $150 million and Project B has an initial outlay of $85 million. Project A will generate additional revenues of 45 million starting at the end of year 1 until the end of year 10. It will also incur additional working capital expenses of $1million immediately, this working capital will be recovered at the end of the project. Project B will generate additional revenues of 25 million starting at the end of year 1 until the end of year 10. It will also incur additional working capital expenses of…arrow_forward5. Risk analysis in capital budgeting Projects differ in risk, and risk analysis is a critical component of the capital budgeting process. Consider the case of United Recycling Inc.: United Recycling Inc. is one of the largest recyclers of glass and paper products in the United States. The company is looking into expanding into the cardboard recycling business. The company’s CFO has performed a detailed analysis of the proposed expansion. The company’s CFO used sophisticated software to analyze a large number of scenarios and generate estimated rates of return and risk indexes. Based on the information given, determine which of the statements is correct. The company’s CFO used a Monte Carlo simulation to evaluate the project’s financial model. The company’s CFO conducted a sensitivity analysis to evaluate the project’s financial model. Evaluating risk is an important part of the capital budgeting process. Which of the following is measured by its…arrow_forwardConsider how Steinback Valley River Park Lodge could use capital budgeting to decide whether the $12,000,000 River Park Lodge expansion would be a good investment. Assume Steinback Valley's managers developed the following estimates concerning the expansion: 1(Click the icon to view the estimates.) Read the requirements2. Requirement 1. Compute the average annual net cash inflow from the expansion. The average annual net cash inflow from the expansion is Requirement 2. Compute the average annual operating income from the expansion. The average annual operating income from the expansion is 1: Data Table Number of additional skiers per day 119 skiers Average number of days per year that weather conditions allow skiing at Steinback Valley 151 days Useful life of expansion (in years) 8 years Average cash spent by each skier per day $244 Average variable cost of serving each skier per day 78 Cost…arrow_forward
 Managerial Accounting: The Cornerstone of Busines...AccountingISBN:9781337115773Author:Maryanne M. Mowen, Don R. Hansen, Dan L. HeitgerPublisher:Cengage Learning
 Survey of Accounting (Accounting I)AccountingISBN:9781305961883Author:Carl WarrenPublisher:Cengage Learning
 Fundamentals of Financial Management, Concise Edi...FinanceISBN:9781285065137Author:Eugene F. Brigham, Joel F. HoustonPublisher:Cengage Learning
 Fundamentals of Financial Management (MindTap Cou...FinanceISBN:9781285867977Author:Eugene F. Brigham, Joel F. HoustonPublisher:Cengage Learning
 Fundamentals Of Financial Management, Concise Edi...FinanceISBN:9781337902571Author:Eugene F. Brigham, Joel F. HoustonPublisher:Cengage Learning
 Fundamentals of Financial Management, Concise Edi...FinanceISBN:9781305635937Author:Eugene F. Brigham, Joel F. HoustonPublisher:Cengage Learning