Fundamentals of Corporate Finance (4th Edition) (Berk, DeMarzo & Harford, The Corporate Finance Series)
4th Edition
ISBN: 9780134475561
Author: Jonathan Berk, Peter DeMarzo, Jarrad Harford
Publisher: PEARSON
expand_more
expand_more
format_list_bulleted
Videos
Textbook Question
Chapter 11, Problem 25P
Consider the following 6 months of returns for 2 stocks and a portfolio of those 2 stocks.
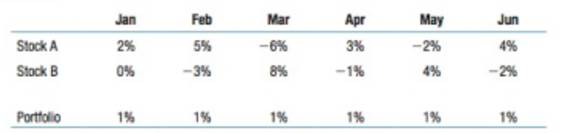
- What is the expected return and standard deviation of returns for each of the two stocks?
- What is the expected return and standard deviation of return for the portfolio?
- Is the portfolio more or less risky than the two stocks? Why?
Expert Solution & Answer
Want to see the full answer?
Check out a sample textbook solution
Students have asked these similar questions
Using the data in the following table,
LOADING...
,
consider a portfolio that maintains a
75% weight on stock A and a
25% weight on stock B.
a. What is the return each year of this portfolio?
b. Based on your results from part
(a),
compute the average return and volatility of the portfolio.
c. Show that (i) the average return of the portfolio is equal to the (weighted) average of the average returns of the two stocks, and (ii) the volatility of the portfolio equals the same result as from the calculation in Eq. 11.9.
d. Explain why the portfolio has a lower volatility than the average volatility of the two stocks.
Question content area bottom
Part 1
a. What is the return each year of this portfolio?
Enter the return of this portfolio for each year in the table below: (Round to two decimal places.)
Year
2010
2011
2012
2013
2014
2015
Portfolio
enter your response here%
enter your response here%
enter your response…
You have invested in a portfolio of two stocks.
Stock A is expected to produce a 7% return next year; the risk factor is 2.5% (standard deviation of the return).
Stock B is expected to produce an 15.5% return next year; the risk factor is 8% (standard deviation of the return).
Your portfolio includes 60% of Stock A and 40% of Stock B.
Compute the expected return of the portfolio.
Compute the standard deviation of the portfolio if the Correlation Coefficient is +1.0
Compute the standard deviation of the portfolio if the Correlation Coefficient is 0.0
Compute the standard deviation of the portfolio if the Correlation Coefficient is -1.0
Use the Standard Deviation of the Portfolio
1.Consider a portfolio of two stocks, A and B. The expected return on Stock A next year is 22% with a standard deviation of 14%. The expected return on Stock B next year is 8% with a standard deviation of 6%. The correlation between the two stocks is 0.3. If 70% of the portfolio is in Stock A and 30% in Stock B, what is the standard deviation of the portfolio?
Chapter 11 Solutions
Fundamentals of Corporate Finance (4th Edition) (Berk, DeMarzo & Harford, The Corporate Finance Series)
Ch. 11 - Prob. 1CCCh. 11 - Why do investors demand a higher return when...Ch. 11 - For what purpose do we use the average and...Ch. 11 - How does the standard deviation of historical...Ch. 11 - What is the relation between risk and return for...Ch. 11 - Prob. 6CCCh. 11 - Prob. 7CCCh. 11 - Prob. 8CCCh. 11 - Prob. 9CCCh. 11 - Does systematic or unsystematic risk require a...
Ch. 11 - What does the historical relation between...Ch. 11 - What are the components of a stock's realized...Ch. 11 - What is the intuition behind using the average...Ch. 11 - Prob. 4CTCh. 11 - How does the relationship between the average...Ch. 11 - Consider two local banks. Bank A has 100 loans...Ch. 11 - What is meant by diversification and how does it...Ch. 11 - Which of the following risks of a stock are likely...Ch. 11 - Prob. 9CTCh. 11 - Prob. 10CTCh. 11 - If you randomly select 10 stocks for a portfolio...Ch. 11 - Why doesn't the risk premium of a stock depend on...Ch. 11 - Prob. 13CTCh. 11 - DATA CASE Today is April 30, 2016, and you have...Ch. 11 - Convert these prices to monthly returns as the...Ch. 11 - Prob. 3DCCh. 11 - Prob. 4DCCh. 11 - Prob. 5DCCh. 11 - What do you notice about the average of the...Ch. 11 - Prob. 1PCh. 11 - Prob. 2PCh. 11 - Prob. 3PCh. 11 - Your portfolio consists of 100 shares of CSH and...Ch. 11 - You have just purchased a share of stock for $20....Ch. 11 - You expect KStreet Co's trade at $100 per share...Ch. 11 - The following table contains prices and dividends...Ch. 11 - Prob. 8PCh. 11 - Prob. 9PCh. 11 - Use the data in SBUX_GOOG.xlsx on MFL to answer...Ch. 11 - Download the spreadsheet from the book's Web the...Ch. 11 - Prob. 12PCh. 11 - Prob. 13PCh. 11 - Prob. 14PCh. 11 - Prob. 15PCh. 11 - Consider the following five monthly returns: a....Ch. 11 - Explain the difference between the arithmetic...Ch. 11 - Prob. 18PCh. 11 - Prob. 19PCh. 11 - Prob. 20PCh. 11 - Prob. 21PCh. 11 - Prob. 22PCh. 11 - Prob. 23PCh. 11 - You are a risk-averse investor who is considering...Ch. 11 - Consider the following 6 months of returns for 2...
Knowledge Booster


Learn more about
Need a deep-dive on the concept behind this application? Look no further. Learn more about this topic, finance and related others by exploring similar questions and additional content below.Similar questions
- You have observed the following returns over time: Assume that the risk-free rate is 6% and the market risk premium is 5%. What are the betas of Stocks X and Y? What are the required rates of return on Stocks X and Y? What is the required rate of return on a portfolio consisting of 80% of Stock X and 20% of Stock Y?arrow_forwardThe following table reports the percentage of stocks in a portfolio for nine quarters: a. Construct a time series plot. What type of pattern exists in the data? b. Use trial and error to find a value of the exponential smoothing coefficient that results in a relatively small MSE. c. Using the exponential smoothing model you developed in part (b), what is the forecast of the percentage of stocks in a typical portfolio for the second quarter of year 3?arrow_forwardAn analyst has modeled the stock of a company using the Fama-French three-factor model. The market return is 10%, the return on the SMB portfolio (rSMB) is 3.2%, and the return on the HML portfolio (rHML) is 4.8%. If ai = 0, bi = 1.2, ci = 20.4, and di = 1.3, what is the stock’s predicted return?arrow_forward
arrow_back_ios
arrow_forward_ios
Recommended textbooks for you
 Intermediate Financial Management (MindTap Course...FinanceISBN:9781337395083Author:Eugene F. Brigham, Phillip R. DavesPublisher:Cengage Learning
 EBK CONTEMPORARY FINANCIAL MANAGEMENTFinanceISBN:9781337514835Author:MOYERPublisher:CENGAGE LEARNING - CONSIGNMENT

 Essentials of Business Analytics (MindTap Course ...StatisticsISBN:9781305627734Author:Jeffrey D. Camm, James J. Cochran, Michael J. Fry, Jeffrey W. Ohlmann, David R. AndersonPublisher:Cengage Learning
Intermediate Financial Management (MindTap Course...
Finance
ISBN:9781337395083
Author:Eugene F. Brigham, Phillip R. Daves
Publisher:Cengage Learning
EBK CONTEMPORARY FINANCIAL MANAGEMENT
Finance
ISBN:9781337514835
Author:MOYER
Publisher:CENGAGE LEARNING - CONSIGNMENT
Essentials of Business Analytics (MindTap Course ...
Statistics
ISBN:9781305627734
Author:Jeffrey D. Camm, James J. Cochran, Michael J. Fry, Jeffrey W. Ohlmann, David R. Anderson
Publisher:Cengage Learning
Investing For Beginners (Stock Market); Author: Daniel Pronk;https://www.youtube.com/watch?v=6Jkdpgc407M;License: Standard Youtube License