
Videos
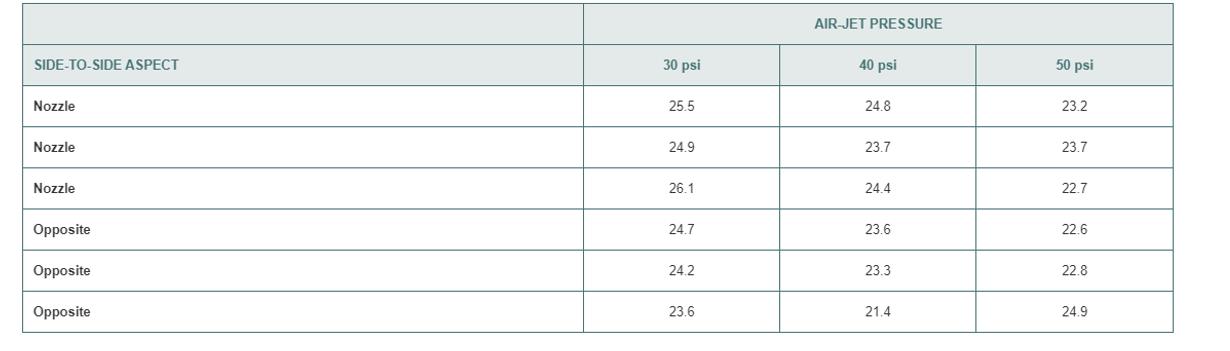
Suppose that, when setting up the experiment in Problem 11.38, the operations manager is able to study the effect of side-to-side aspect in addition to air-jet pressure. Thus, instead of the one-factor completely randomized design in Problem 11.38, a two-factor factorial design was used, with first factor, side-to-side aspect, having two levels (nozzle and opposite) and the second factor, air-jet pressure, having three levels (30 psi, 40 psi, and 50 psi). A sample of 18 yarns is randomly assigned, 3 to each of the 6-side-to-side aspect and pressure level combinations. The breaking-strength, stored in yarn, are as follows:
At the 0.05 level of significance.
a. is there an interaction between side-to-side aspect and air-jet pressure?
b. is there an effect due to side-to-side aspect?
c. is there an effect due to air-jet pressure?
d. Plot the mean yarn breaking strength for each level to side-to-side aspect for each level of air-jet pressure.
e. if appropriate, use the Turkey procedure to study difference among the air-jet pressures.
f. On the basis of the results of (a) through (e), what conclusions can you reach concerning yarn breaking strength? Discuss.
g. Compare your results in (a) through (f) with those from the completely randomized design in Problem 11.38. Discuss fully.
Want to see the full answer?
Check out a sample textbook solution
Chapter 11 Solutions
BASIC BUSINESS STATISTICS-STUD.SOLN.MAN


- Suppose we are interested in comparing the proportion of male students who smoke to the proportion of female students who smoke. We have a random sample of 150 students (60 males and 90 females) that includes two variables: Smoke = "yes" or "no" and Gender = "female (F)" or "male (M)". The two-way table below summarizes the results. Smoke = Yes Smoke = No Sample Size 60 90 Gender = M Gender = F Reference: 3-15-No Tech 9 9 51 81 Describe how to use the data to construct a bootstrap distribution. What value should be recorded for each of the bootstrap samples.arrow_forwardStudy 1: A study of 300 high school students was done. Half of them were instructed to drink soda every day. The other half was instructed to not drink soda at all. After one month, the half that were drinking soda had gained an average of five pounds more than the half that did not drink soda. e. How could this study be changed to make it a double-blind study?arrow_forwardNeed help.arrow_forward
- Mars, Inc. claims that 20% of its M & M plain candies out of a sample of 100 are blue. Does your data (your individual package) agree, why or why not?arrow_forwardA depression study reports the following findings. There were no significant differences on depression symptoms across ethnic groups (Asian, latino, caucasian, African american ) or across treatment location.(home vs. clinic). Which of the following statements about the design is TRUE. 1. This would be considered a 2×2 ANOVA 2. There are 4 independent variables included here. 3. The ethnicity variable has 4 level and the treatment location variable has 2 levels. 4.There's a total of 4 separate group in this study.arrow_forwardPlease help. Thanks! Experiment 5: What is the relationship between soft drinks and obesity?The director of an obesity clinic in a large northwestern city believes that drinking soft drinks contributes to obesity in children. To determine whether a relationship exists between these two variables, she conducts the following pilot study. Eight 12-year-old male volunteers are randomly selected from children attending a local junior high school. Parents of the children are asked to monitor the number of soft drinks consumed by their child over a 1-week period. The children are weighed at the end of the week and their weights converted into body mass index (BMI) values. The BMI is a common index used to measure obesity and takes into account both height and weight. An individual is considered obese if they have a BMI value 30. The following data are collected: Please provide needs to have the following information: Hypotheses: both alternative and the null . Mean and standard deviation of…arrow_forward
- A researcher is comparing the occurrence of nausea as a side-effect in two brands of medication: Brand A and Brand B. For a random sample of 150 Brand A users, 66 experienced nausea as a side-effect. For a random sample of 200 Brand B users, 118 experienced nausea as a side-effect. Can the researcher conclude that the proportion of all Brand A users who experience nausea as a side-effect is different from the proportion of all Brand B users who experience nausea as a side-effect. For the hypothesis testing scenario above, the researcher concludes that the two proportions are different at the 0.01 significance level. Compute the 99% confidence interval to estimate the difference.arrow_forwardA health officer is trying to study the malaria situation of Zambia. From the records of seasonal blood survey (SBS) results he came to understand that the proportion of people having malaria in Zambia was 3.8% in 2015. The size of the sample considered was 15,000. He also realized that during the year that followed (2016), blood samples were taken from 10,000 randomly selected persons. The result of the 2016 seasonal blood survey showed that 200 persons were positive for malaria. Help the Health officer in testing the hypothesis that the malaria situation of 2016 did not show any significant difference from that of 2015 (take the 5% level of significance).arrow_forwardPlease answer questions a, b and c with working.arrow_forward
- A company wishes to evaluate the effect of package design on one of its products, a certain brand of cereal. The four package designs are to be tested in different stores throughout a large city. There are 20 stores available for the study. The amount of cereal sold is known to vary depending on the size of the stores. The 20 stores are divided into five groups of four stores each by size. The following sales figures ($1000s) were obtained after a 1-month period. Stores Design A Design B Design C Design D 1 40 33 37 38 2 45 27 32 40 3 43 31 30 41 4 44 38 40 42 5 56 45 49 42 Enter the above data into a suitable software and then conduct an analysis of variance without blocking to test whether there is evidence of a significant difference in mean sales of different package designs. Use alpha = 0.01. What are the mean squares for error? Please provide your answer to the nearest two decimal places.arrow_forwardA company wishes to evaluate the effect of package design on one of its products, a certain brand of cereal. The four package designs are to be tested in different stores throughout a large city. There are 20 stores available for the study. The amount of cereal sold is known to vary depending on the size of the stores. The 20 stores are divided into five groups of four stores each by size. The following sales figures ($1000s) were obtained after a 1-month period. Stores Design A Design B Design C Design D 1 40 33 37 38 2 45 27 32 40 3 43 31 30 41 4 44 38 40 42 5 56 45 49 42 Enter the above data into a suitable software and then conduct an analysis of variance without blocking to test whether there is evidence of a significant difference in mean sales of different package designs. Use alpha=0.01. What is the conclusion for the null hypothesis that all treatment means are equal? O Do not reject HO. There is sufficient evidence to conclude that the average sales for all stores are not…arrow_forwardA company wishes to evaluate the effect of package design on one of its products, a certain brand of cereal. The four package designs are to be tested in different stores throughout a large city. There are 20 stores available for the study. The amount of cereal sold is known to vary depending on the size of the stores. The 20 stores are divided into five groups of four stores each by size. The following sales figures ($1000s) were obtained after a 1-month period. Stores Design A Design B Design C Design D 1 40 33 37 38 2 45 27 32 40 3 43 31 30 41 4 44 38 40 42 5 56 45 49 42 Enter the above data into a suitable software and then conduct an analysis of variance with blocking (analyze this data as a complete block design) to test further whether there is evidence of a significant difference in mean sales of different package designs. Use alpha = 0.01. What are the degrees of freedom for error?arrow_forward
 MATLAB: An Introduction with ApplicationsStatisticsISBN:9781119256830Author:Amos GilatPublisher:John Wiley & Sons Inc
 Probability and Statistics for Engineering and th...StatisticsISBN:9781305251809Author:Jay L. DevorePublisher:Cengage Learning
 Statistics for The Behavioral Sciences (MindTap C...StatisticsISBN:9781305504912Author:Frederick J Gravetter, Larry B. WallnauPublisher:Cengage Learning
 Elementary Statistics: Picturing the World (7th E...StatisticsISBN:9780134683416Author:Ron Larson, Betsy FarberPublisher:PEARSON
 The Basic Practice of StatisticsStatisticsISBN:9781319042578Author:David S. Moore, William I. Notz, Michael A. FlignerPublisher:W. H. Freeman
 Introduction to the Practice of StatisticsStatisticsISBN:9781319013387Author:David S. Moore, George P. McCabe, Bruce A. CraigPublisher:W. H. Freeman