
Concept explainers
Videos
You now have $5000. You will toss a fair coin four times. Before each toss you can bet any amount of your money (including none) on the outcome of the toss. If heads comes up, you win the amount you bet. If tails comes up, you lose the amount you bet. Your goal is to reach $15,000. It turns out that you can maximize your chance of reaching $15,000 by betting either the money you have on hand or $15,000 minus the money you have on hand, whichever is smaller. Use simulation to estimate the probability that you will reach your goal with this betting strategy.
To estimate: The probability that Person X would reach the goal with the betting strategy.
Introduction: Simulation model is the digital prototype of the physical model that helps to forecast the performance of the system or model in the real world.
Explanation of Solution
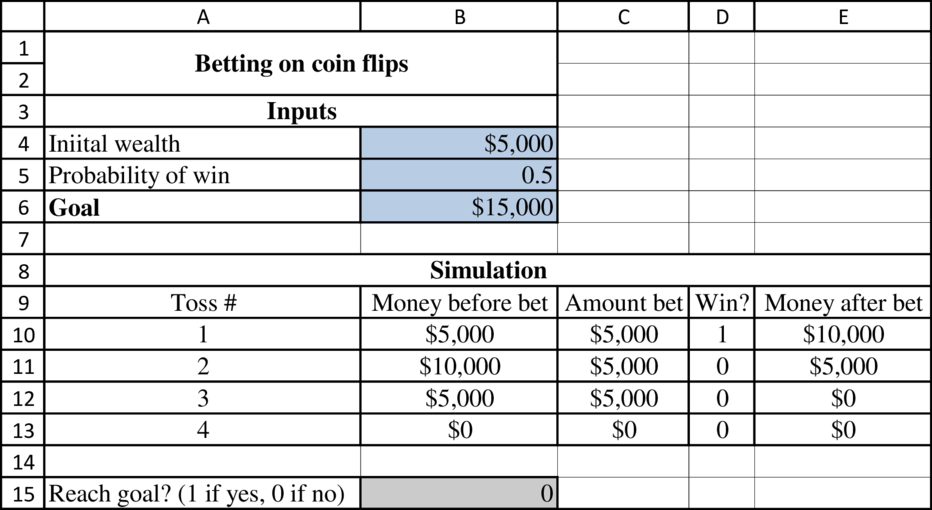
Formulae to determine the above table:
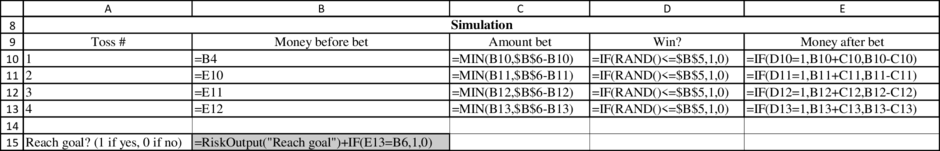
Output results:
The following table is attained by running the simulation @RISK by placing the cursor at B15:
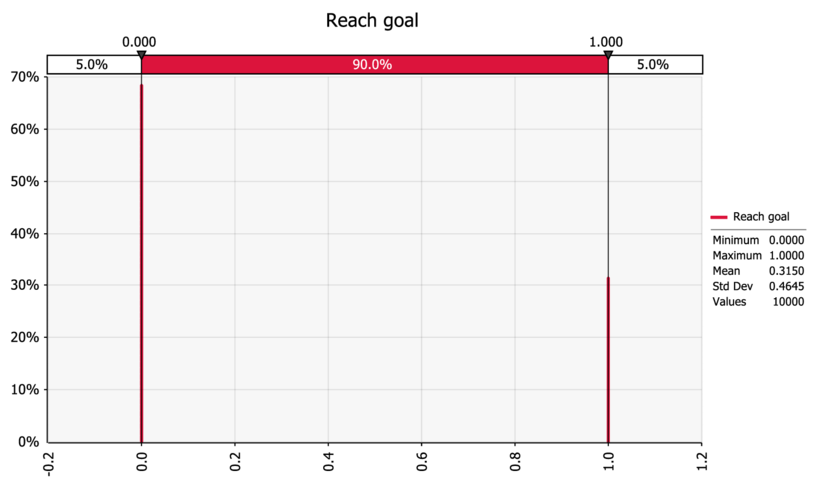
The gambler reaches the goal about 31.5% of the time
Want to see more full solutions like this?
Chapter 11 Solutions
Practical Management Science


- Based on Kelly (1956). You currently have 100. Each week you can invest any amount of money you currently have in a risky investment. With probability 0.4, the amount you invest is tripled (e.g., if you invest 100, you increase your asset position by 300), and, with probability 0.6, the amount you invest is lost. Consider the following investment strategies: Each week, invest 10% of your money. Each week, invest 30% of your money. Each week, invest 50% of your money. Use @RISK to simulate 100 weeks of each strategy 1000 times. Which strategy appears to be best in terms of the maximum growth rate? (In general, if you can multiply your investment by M with probability p and lose your investment with probability q = 1 p, you should invest a fraction [p(M 1) q]/(M 1) of your money each week. This strategy maximizes the expected growth rate of your fortune and is known as the Kelly criterion.) (Hint: If an initial wealth of I dollars grows to F dollars in 100 weeks, the weekly growth rate, labeled r, satisfies F = (I + r)100, so that r = (F/I)1/100 1.)arrow_forwardIn this version of dice blackjack, you toss a single die repeatedly and add up the sum of your dice tosses. Your goal is to come as close as possible to a total of 7 without going over. You may stop at any time. If your total is 8 or more, you lose. If your total is 7 or less, the house then tosses the die repeatedly. The house stops as soon as its total is 4 or more. If the house totals 8 or more, you win. Otherwise, the higher total wins. If there is a tie, the house wins. Consider the following strategies: Keep tossing until your total is 3 or more. Keep tossing until your total is 4 or more. Keep tossing until your total is 5 or more. Keep tossing until your total is 6 or more. Keep tossing until your total is 7 or more. For example, suppose you keep tossing until your total is 4 or more. Here are some examples of how the game might go: You toss a 2 and then a 3 and stop for total of 5. The house tosses a 3 and then a 2. You lose because a tie goes to the house. You toss a 3 and then a 6. You lose. You toss a 6 and stop. The house tosses a 3 and then a 2. You win. You toss a 3 and then a 4 for total of 7. The house tosses a 3 and then a 5. You win. Note that only 4 tosses need to be generated for the house, but more tosses might need to be generated for you, depending on your strategy. Develop a simulation and run it for at least 1000 iterations for each of the strategies listed previously. For each strategy, what are the two values so that you are 95% sure that your probability of winning is between these two values? Which of the five strategies appears to be best?arrow_forwardYou have 5 and your opponent has 10. You flip a fair coin and if heads comes up, your opponent pays you 1. If tails comes up, you pay your opponent 1. The game is finished when one player has all the money or after 100 tosses, whichever comes first. Use simulation to estimate the probability that you end up with all the money and the probability that neither of you goes broke in 100 tosses.arrow_forward
- You now have 10,000, all of which is invested in a sports team. Each year there is a 60% chance that the value of the team will increase by 60% and a 40% chance that the value of the team will decrease by 60%. Estimate the mean and median value of your investment after 50 years. Explain the large difference between the estimated mean and median.arrow_forwardThe game of Chuck-a-Luck is played as follows: You pick a number between 1 and 6 and toss three dice. If your number does not appear, you lose 1. If your number appears x times, you win x. On the average, use simulation to find the average amount of money you will win or lose on each play of the game.arrow_forwardThe IRR is the discount rate r that makes a project have an NPV of 0. You can find IRR in Excel with the built-in IRR function, using the syntax =IRR(range of cash flows). However, it can be tricky. In fact, if the IRR is not near 10%, this function might not find an answer, and you would get an error message. Then you must try the syntax =IRR(range of cash flows, guess), where guess" is your best guess for the IRR. It is best to try a range of guesses (say, 90% to 100%). Find the IRR of the project described in Problem 34. 34. Consider a project with the following cash flows: year 1, 400; year 2, 200; year 3, 600; year 4, 900; year 5, 1000; year 6, 250; year 7, 230. Assume a discount rate of 15% per year. a. Find the projects NPV if cash flows occur at the ends of the respective years. b. Find the projects NPV if cash flows occur at the beginnings of the respective years. c. Find the projects NPV if cash flows occur at the middles of the respective years.arrow_forward
- It is surprising (but true) that if 23 people are in the same room, there is about a 50% chance that at least two people will have the same birthday. Suppose you want to estimate the probability that if 30 people are in the same room, at least two of them will have the same birthday. You can proceed as follows. a. Generate random birthdays for 30 different people. Ignoring the possibility of a leap year, each person has a 1/365 chance of having a given birthday (label the days of the year 1 to 365). You can use the RANDBETWEEN function to generate birthdays. b. Once you have generated 30 peoples birthdays, how can you tell whether at least two people have the same birthday? One way is to use Excels RANK function. (You can learn how to use this function in Excels online help.) This function returns the rank of a number relative to a given group of numbers. In the case of a tie, two numbers are given the same rank. For example, if the set of numbers is 4, 3, 2, 5, the RANK function returns 2, 3, 4, 1. (By default, RANK gives 1 to the largest number.) If the set of numbers is 4, 3, 2, 4, the RANK function returns 1, 3, 4, 1. c. After using the RANK function, you should be able to determine whether at least two of the 30 people have the same birthday. What is the (estimated) probability that this occurs?arrow_forwardBased on Babich (1992). Suppose that each week each of 300 families buys a gallon of orange juice from company A, B, or C. Let pA denote the probability that a gallon produced by company A is of unsatisfactory quality, and define pB and pC similarly for companies B and C. If the last gallon of juice purchased by a family is satisfactory, the next week they will purchase a gallon of juice from the same company. If the last gallon of juice purchased by a family is not satisfactory, the family will purchase a gallon from a competitor. Consider a week in which A families have purchased juice A, B families have purchased juice B, and C families have purchased juice C. Assume that families that switch brands during a period are allocated to the remaining brands in a manner that is proportional to the current market shares of the other brands. For example, if a customer switches from brand A, there is probability B/(B + C) that he will switch to brand B and probability C/(B + C) that he will switch to brand C. Suppose that the market is currently divided equally: 10,000 families for each of the three brands. a. After a year, what will the market share for each firm be? Assume pA = 0.10, pB = 0.15, and pC = 0.20. (Hint: You will need to use the RISKBINOMLAL function to see how many people switch from A and then use the RISKBENOMIAL function again to see how many switch from A to B and from A to C. However, if your model requires more RISKBINOMIAL functions than the number allowed in the academic version of @RISK, remember that you can instead use the BENOM.INV (or the old CRITBENOM) function to generate binomially distributed random numbers. This takes the form =BINOM.INV (ntrials, psuccess, RAND()).) b. Suppose a 1% increase in market share is worth 10,000 per week to company A. Company A believes that for a cost of 1 million per year it can cut the percentage of unsatisfactory juice cartons in half. Is this worthwhile? (Use the same values of pA, pB, and pC as in part a.)arrow_forwardConsider the following card game. The player and dealer each receive a card from a 52-card deck. At the end of the game the player with the highest card wins; a tie goes to the dealer. (You can assume that Aces count 1, Jacks 11, Queens 12, and Kings 13.) After the player receives his card, he keeps the card if it is 7 or higher. If the player does not keep the card, the player and dealer swap cards. Then the dealer keeps his current card (which might be the players original card) if it is 9 or higher. If the dealer does not keep his card, he draws another card. Use simulation with at least 1000 iterations to estimate the probability that the player wins. (Hint: See the file Sampling Without Replacement.xlsx, one of the example files, to see a clever way of simulating cards from a deck so that the Same card is never dealt more than once.)arrow_forward
- A martingale betting strategy works as follows. You begin with a certain amount of money and repeatedly play a game in which you have a 40% chance of winning any bet. In the first game, you bet 1. From then on, every time you win a bet, you bet 1 the next time. Each time you lose, you double your previous bet. Currently you have 63. Assuming you have unlimited credit, so that you can bet more money than you have, use simulation to estimate the profit or loss you will have after playing the game 50 times.arrow_forwardA common decision is whether a company should buy equipment and produce a product in house or outsource production to another company. If sales volume is high enough, then by producing in house, the savings on unit costs will cover the fixed cost of the equipment. Suppose a company must make such a decision for a four-year time horizon, given the following data. Use simulation to estimate the probability that producing in house is better than outsourcing. If the company outsources production, it will have to purchase the product from the manufacturer for 25 per unit. This unit cost will remain constant for the next four years. The company will sell the product for 42 per unit. This price will remain constant for the next four years. If the company produces the product in house, it must buy a 500,000 machine that is depreciated on a straight-line basis over four years, and its cost of production will be 9 per unit. This unit cost will remain constant for the next four years. The demand in year 1 has a worst case of 10,000 units, a most likely case of 14,000 units, and a best case of 16,000 units. The average annual growth in demand for years 2-4 has a worst case of 7%, a most likely case of 15%, and a best case of 20%. Whatever this annual growth is, it will be the same in each of the years. The tax rate is 35%. Cash flows are discounted at 8% per year.arrow_forwardIf you want to replicate the results of a simulation model with Excel functions only, not @RISK, you can build a data table and let the column input cell be any blank cell. Explain why this works.arrow_forward
 Practical Management ScienceOperations ManagementISBN:9781337406659Author:WINSTON, Wayne L.Publisher:Cengage,