
Videos
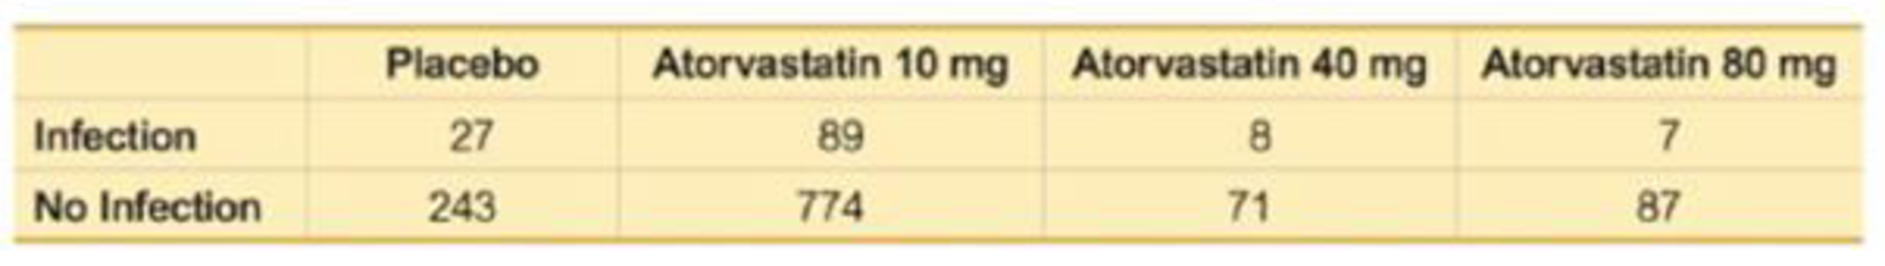
Clinical Trial of Lipitor Lipitor is the trade name of the drug atorvastatin, which is used to reduce cholesterol in patients. (Until its patent expired in 2011. this was the largest-selling drug in the world, with annual sales of $13 billion.) Adverse reactions have been studied in clinical trials, and the table below summarizes results for infections in patients from different treatment groups (based on data from Parke-Davis). Use a 0.01 significance level to test the claim that getting an infection is independent of the treatment. Does the atorvastatin (Lipitor) treatment appear to have an effect on infections?
Want to see the full answer?
Check out a sample textbook solution
Chapter 11 Solutions
Essentials of Statistics Plus MyLab Statistics with Pearson eText -- Access Card Package (6th Edition) (What's New in Statistics)


- What does the y -intercept on the graph of a logistic equation correspond to for a population modeled by that equation?arrow_forwardYou are concerned that nausea may be a side effect of Tamiflu, but you cannot just give Tamiflu to patients with the flu and say that nausea is a side effect if people become nauseous. This is because nausea is common for people who have the flu. From past studies you know that about 35% of people who get the flu experience nausea. You collected data on 1855 patients who were taking Tamiflu to relieve symtoms of the flu, and found that 705 experienced nausea. Use a 0.01 significance level to test the claim that the percentage of people who take Tamiflu for the relief of flu symtoms and experience nausea is greater than 35%.a) Identify the null and alternative hypotheses? b) What type of hypothesis test should you conduct (left-, right-, or two-tailed)? c) Identify the appropriate significance level. d) Calculate your test statistic (use ˆpp^ rounded to 4 decimal places). Round your test statistic to 4 decimal places. e) Calculate your p-value and round to 4 decimal places. f) Do you…arrow_forwardYou are concerned that nausea may be a side effect of Tamiflu, but you cannot just give Tamiflu to patients with the flu and say that nausea is a side effect if people become nauseous. This is because nausea is common for people who have the flu. From past studies you know that about 35% of people who get the flu experience nausea. You collected data on 1855 patients who were taking Tamiflu to relieve symtoms of the flu, and found that 705 experienced nausea. Use a 0.01 significance level to test the claim that the percentage of people who take Tamiflu for the relief of flu symtoms and experience nausea is greater than 35%. Calculate your test statistic (use ˆpp^ rounded to 4 decimal places). Round your test statistic to 4 decimal places. Calculate your p-value and round to 4 decimal places.arrow_forward
- You are concerned that nausea may be a side effect of Tamiflu, but you cannot just give Tamiflu to patients with the flu and say that nausea is a side effect if people become nauseous. This is because nausea is common for people who have the flu. From past studies you know that about 35% of people who get the flu experience nausea. You collected data on 1855 patients who were taking Tamiflu to relieve symtoms of the flu, and found that 705 experienced nausea. Use a 0.01 significance level to test the claim that the percentage of people who take Tamiflu for the relief of flu symtoms and experience nausea is greater than 35%. You are concerned that nausea may be a side effect of Tamiflu, but you cannot just give Tamiflu to patients with the flu and say that nausea is a side effect if people become nauseous. This is because nausea is common for people who have the flu. From past studies you know that about 35% of people who get the flu experience nausea. You collected data on 1855…arrow_forwardYou are concerned that nausea may be a side effect of Tamiflu, but you cannot just give Tamiflu to patients with the flu and say that nausea is a side effect if people become nauseous. This is because nausea is common for people who have the flu. From past studies you know that about 34% of people who get the flu experience nausea. You collected data on 1926 patients who were taking Tamiflu to relieve symtoms of the flu, and found that 711 experienced nausea. Use a 0.01 significance level to test the claim that the percentage of people who take Tamiflu for the relief of flu symtoms and experience nausea is greater than 34%. a) Identify the null and alternative hypotheses? Ho: ? H₁: ? b) What type of hypothesis test should you conduct (left-, right-, or two-tailed)? left-tailed right-tailed O two-tailed c) Identify the appropriate significance level. d) Calculate your test statistic. Write the result below, and be sure to round your final answer to two decimal places. e) Calculate your…arrow_forwardThe glycemic index (GI) is a rating system for foods containing carbohydrates. It shows how quickly each food affects your blood sugar (glucose) level when that food is eaten on its own. A random sample of 33 children were provided with a breakfast of low GI foods on one day and high GI foods on another. The two breakfasts contained the same quantities of carbohydrate, fat and protein. On each day a buffet lunch was provided, and the number of calories eaten at lunchtime were recorded. On the first day the children ate a low GI breakfast and on the second day a high GI breakfast. Let be the true mean of the differences in calorie intake for a high GI and a low GI breakfast, respectively. The researcher wants to conduct inference on to determine whether the kind of breakfast eaten has an effect on mean calorie intake. The differences are calculated as calorie intake after high-GI breakfast minus calorie intake after low-GI breakfast. The sample mean of the differences of 63.543…arrow_forward
- You are concerned that nausea may be a side effect of Tamiflu, but you cannot just give Tamiflu to patients with the flu and say that nausea is a side effect if people become nauseous. This is because nausea is common for people who have the flu. From past studies you know that about 30% of people who get the flu experience nausea. You collected data on 1744 patients who were taking Tamiflu to relieve symtoms of the flu, and found that 572 experienced nausea. Use a 0.01 significance level to test the claim that the percentage of people who take Tamiflu for the relief of flu symtoms and experience nausea is greater than 30%.a) Identify the null and alternative hypotheses?�0: �1: b) What type of hypothesis test should you conduct (left-, right-, or two-tailed)? left-tailed right-tailed two-tailed c) Identify the appropriate significance level.d) Calculate your test statistic. Write the result below, and be sure to round your final answer to two decimal…arrow_forwardMonoamine oxidase (MAO) is an enzyme that is thought to play a role in the regulation of behavior. To see whether different categories of patients with schizophrenia have different levels of MAO activity, researchers collected blood specimens from 42 patients and measured the MAO activity in the platelets. The results are partially summarized in the accompanying tables. Table 2. Summary measures for the MAO activity in the blood of 42 patients as categorized according to the type of schizophrenia. Diagnosis Mao activity Mean SD No. of patients Chronic undifferentiated schizophrenia 9.81 3.62 18 Undifferentiated with paranoid features 6.28 2.88 16 Paranoid schizophrenia 5.97 3.19 8 Table 3. ANOVA table for Lab Exercise 10.2 Source df Sum of squares Mean square statistic Between XX 136.12 68.06 XX Within XX 418.25 10.72 Total XX 554.37 How many degrees of freedom…arrow_forwardThe glycemic index (GI) is a rating system for foods containing carbohydrates. It shows how quickly each food affects your blood sugar (glucose) level when that food is eaten on its own. A random sample of 33 children were provided with a breakfast of low GI foods on one day and high GI foods on another. The two breakfasts contained the same quantities of carbohydrate, fat and protein. On each day a buffet lunch was provided, and the number of calories eaten at lunchtime were recorded. On the first day the children ate a low GI breakfast and on the second day a high GI breakfast. Let be the true mean of the differences in calorie intake for a high GI and a low GI breakfast, respectively. The researcher wants to conduct inference on to determine whether the kind of breakfast eaten has an effect on mean calorie intake. The differences are calculated as calorie intake after high-GI breakfast minus calorie intake after low-GI breakfast. The sample mean of the differences of 63.543…arrow_forward
- A Dr is doing a test on diseases. He has a population of 1,000,000 with a disease affecting .01% of the population. There is a test for the disease which is 99% accurate. A positive test result indicates that the person has the disease. How would I complete the table below assuming that the entire population (1,000,000 individuals) is tested for the disease?arrow_forwardRecent research indicates that the effectiveness of antidepressant medication is directly related to the severity of the depression (Khan, Brodhead, Kolts & Brown, 2005). Based on pretreatment depression scores, patients were divided into four groups based on their level of depression. After receiving the antidepressant medication, depression scores were measured again and the amount of improvement was recorded for each patient. The following data are similar to the results of the study. (see image #1) This is the summary table for the ANOVA test: S.S. d.f. M.S. Between 22.612239583333 3 7.5374131944444 Within 198.05895833333 188 1.0535050975177 TOTAL 220.67119791667 191 From this table, you obtain the necessary statistics for the ANOVA:F-ratio: 7.154605338127p-value: 0.00014η2=η2= 0.10247028065653What is your final conclusion? Use a significance level of α=0.01α=0.01. There is a significant difference between treatments These data do not provide evidence of a…arrow_forwardA researcher assessed the effects of a new drug on migraine headaches. One sample of migraine sufferers received a placebo pill (0 milligrams of the drug) every day for a month. A second sample received a 10-mg dose of the drug daily for a month, and a third sample received daily doses of 20-mg. The number of headaches each person had during the month was recorded. The results are summarized in the following table: What is the independent variable (IV)? How many levels do we have for the IV? What is the level of measurement for the IV? What is the DV (remember, the DV is the data)? What is the level of measurement of the DV? What is the best graph to display this data? Explain. Construct a graph (by hand) that incorporates all the information in this table. Looking at your graph, do you think that the new drug treatment really worked. Explain your answer.arrow_forward
 Calculus For The Life SciencesCalculusISBN:9780321964038Author:GREENWELL, Raymond N., RITCHEY, Nathan P., Lial, Margaret L.Publisher:Pearson Addison Wesley,
 Linear Algebra: A Modern IntroductionAlgebraISBN:9781285463247Author:David PoolePublisher:Cengage Learning
 Glencoe Algebra 1, Student Edition, 9780079039897...AlgebraISBN:9780079039897Author:CarterPublisher:McGraw Hill