Concept explainers
Videos
Application Exercises
The graphs show the percentage of high school seniors who had ever used alcohol or marijuana.
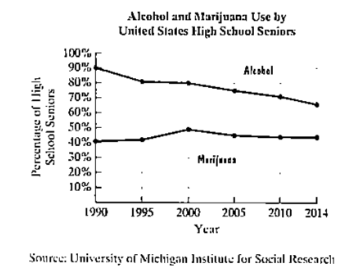
The data can be described by the following mathematical models:

Use this information to solve Exercises 55–56.
a. Use the appropriate line graph to estimate the percentage of seniors who used alcohol in 2014.
b. Use the appropriate formula to determine the percentage of seniors who used alcohol in 2014. How does this compare with your estimate in part (a)?
c. Use the appropriate line graph to estimate the percentage of seniors who used marijuana in 2014.
d. Use the appropriate formula to determine the percentage of seniors who used marijuana in 2014. How does this compare with your estimate in part (c)?
e. For the period from 1990 through 2014, in which year was alcohol use by seniors at a maximum? What percentage of seniors used alcohol in that year.
Want to see the full answer?
Check out a sample textbook solution
Chapter 1 Solutions
College Algebra, Books a la Carte Edition (7th Edition)


- Applications In Exercises 81-91, assume straight-line depreciation or straight-line appreciation. Purchase price of real estate A cottage that was purchased 3 years ago is now appraised at 47,700. If the property has been appreciating 3500 per year, find its original price.arrow_forwardMathematical Models In Exercises 9 and 10, (a) plot the actual data and the model of the same graph and (b) describe how closely the model represents the data. If the model does not closely represent the data, suggest another type of model that may be a better fit. The ordered pairs below give the revenues y (in billions of dollars) for Activision Blizzard, Inc., from 2008 through 2014. 2008,3.032012,4.862009,4.282013,4.582010,4.452014,4.412011,4.76 A model for the data is y=0.184t+2.32,8t14, where t represents the year, with t=8 corresponding to 2008.arrow_forwardSalary after College. In 2010, MonsterCollege surveyed 1250 U.S.college students expecting to graduate in the next several years. Respondents were asked the following question: What do you think your starting salary will be at your first job after college? The line graph shows the percentage of college students who anticipated various starting salaries. Then Solve; The mathematical model p = -0.01s2 + 0.8s + 3.7 describes the percentage of college students, p, who anticipated a starting salary s, in thousands of dollars. Use this formula to find the percentage of students who anticipated a starting salary of $40 thousand. How does this compare with your estimate about the percentage of students who anticipated a starting salary of $40 thousand.arrow_forward
- (a) according to the linear model, What was the average cost of the room and board at public four year colleges for the school year ending in 2015? The average cost in 2015 was $___(Round to the nearest Dollar as needed)arrow_forwarde. How well does the equation explain gasoline prices? Be specific.arrow_forward

 College Algebra (MindTap Course List)AlgebraISBN:9781305652231Author:R. David Gustafson, Jeff HughesPublisher:Cengage Learning
 Glencoe Algebra 1, Student Edition, 9780079039897...AlgebraISBN:9780079039897Author:CarterPublisher:McGraw Hill
 Algebra & Trigonometry with Analytic GeometryAlgebraISBN:9781133382119Author:SwokowskiPublisher:Cengage
 Trigonometry (MindTap Course List)TrigonometryISBN:9781337278461Author:Ron LarsonPublisher:Cengage Learning
 Big Ideas Math A Bridge To Success Algebra 1: Stu...AlgebraISBN:9781680331141Author:HOUGHTON MIFFLIN HARCOURTPublisher:Houghton Mifflin Harcourt