
a.
Determine the decision rule.
a.
Explanation of Solution
Calculation:
Degrees of freedom:
The degrees of freedom is as follows:
Step-by-step procedure to obtain the critical value using MINITAB software:
- 1. Choose Graph > Probability Distribution Plot choose View Probability > OK.
- 2. From Distribution, choose ‘t’ distribution.
- 3. In Degrees of freedom, enter 16.
- 4. Click the Shaded Area tab.
- 5. Choose the P Value and Two Tail for the region of the curve to shade.
- 6. Enter the probability value as 0.05.
- 7. Click OK.
Output obtained using MINITAB software is given below:
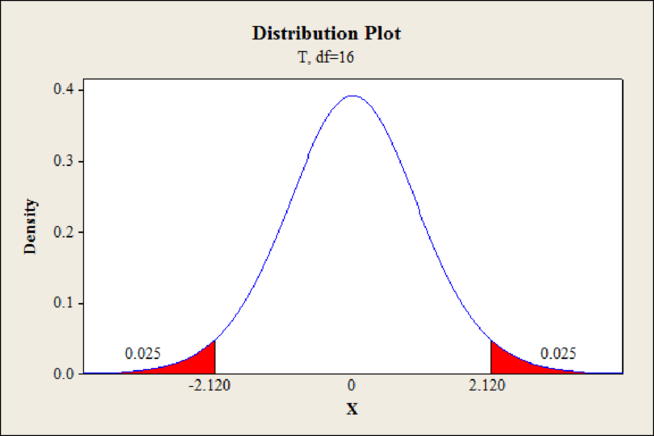
From the MINITAB output, the critical value is
The decision rule is,
If
If
b.
Find the value of the pooled estimate of the population variance.
b.
Answer to Problem 7E
The pooled estimate of the population variance is 19.9375.
Explanation of Solution
Calculation:
Pooled estimate:
The pooled estimate of the population variance is as follows:
Substitute
Thus, the pooled estimate of the population variance is 19.9375.
c.
Find the value of test statistic.
c.
Answer to Problem 7E
The value of the test statistic is –1.416.
Explanation of Solution
Test statistic:
The test statistic for the hypothesis test of
Substitute
Thus, the test statistic is –1.416.
d.
Determine the decision regarding
d.
Answer to Problem 7E
The decision is fail to reject the null hypothesis.
Explanation of Solution
Decision:
The critical value is –2.120 and the value of test statistic is –1.416.
The value of the test statistic is greater than the critical value.
That is,
From the decision rule, fail to reject the null hypothesis.
e.
Find the p-value.
e.
Answer to Problem 7E
The p-value is 0.175.
Explanation of Solution
Step-by-step procedure to obtain the p-value using MINITAB software:
- 1. Choose Graph > Probability Distribution Plot choose View Probability > OK.
- 2. From Distribution, choose ‘t’ distribution.
- 3. In Degrees of freedom, enter 16.
- 4. Click the Shaded Area tab.
- 5. Choose X Value and Two Tail for the region of the curve to shade.
- 6. Enter the X value as –1.416.
- 7. Click OK.
Output obtained using MINITAB software is given below:
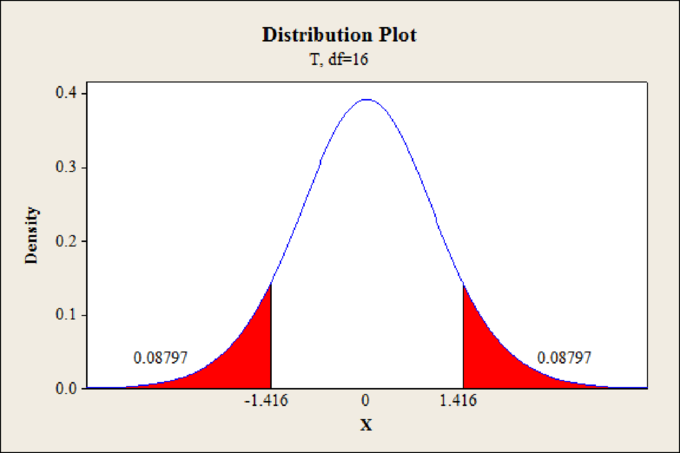
From the MINITAB output, the p-value for one side is 0.08797.
Thus, the p-value is 0.175.
Want to see more full solutions like this?
Chapter 11 Solutions
STATISTICAL TECHNIQUES IN BUS.+ECON(LL

 MATLAB: An Introduction with ApplicationsStatisticsISBN:9781119256830Author:Amos GilatPublisher:John Wiley & Sons Inc
 Probability and Statistics for Engineering and th...StatisticsISBN:9781305251809Author:Jay L. DevorePublisher:Cengage Learning
 Statistics for The Behavioral Sciences (MindTap C...StatisticsISBN:9781305504912Author:Frederick J Gravetter, Larry B. WallnauPublisher:Cengage Learning
 Elementary Statistics: Picturing the World (7th E...StatisticsISBN:9780134683416Author:Ron Larson, Betsy FarberPublisher:PEARSON
 The Basic Practice of StatisticsStatisticsISBN:9781319042578Author:David S. Moore, William I. Notz, Michael A. FlignerPublisher:W. H. Freeman
 Introduction to the Practice of StatisticsStatisticsISBN:9781319013387Author:David S. Moore, George P. McCabe, Bruce A. CraigPublisher:W. H. Freeman