
Concept explainers
Videos
For Exercises 7 and 8: (a) state the decision rule, (b) compute the pooled estimate of the population variance, (c) compute the test statistic, (d) state your decision about the null hypothesis, and (e) estimate the p-value.
8. The null and alternate hypotheses are:
A random sample of 15 observations from the first population revealed a sample mean of 350 and a sample standard deviation of 12. A random sample of 17 observations from the second population revealed a sample mean of 342 and a sample standard deviation of 15. At the .10 significance level, is there a difference in the population means?
a.
Determine the decision rule.
Explanation of Solution
Calculation:
Degrees of freedom:
The degrees of freedom is as follows:
Step-by-step procedure to obtain the critical value using MINITAB software:
- 1. Choose Graph > Probability Distribution Plot choose View Probability > OK.
- 2. From Distribution, choose ‘t’ distribution.
- 3. In Degrees of freedom, enter 30.
- 4. Click the Shaded Area tab.
- 5. Choose P Value and Two Tail for the region of the curve to shade.
- 6. Enter the probability value as 0.05.
- 7. Click OK.
Output obtained using MINITAB software is given below:
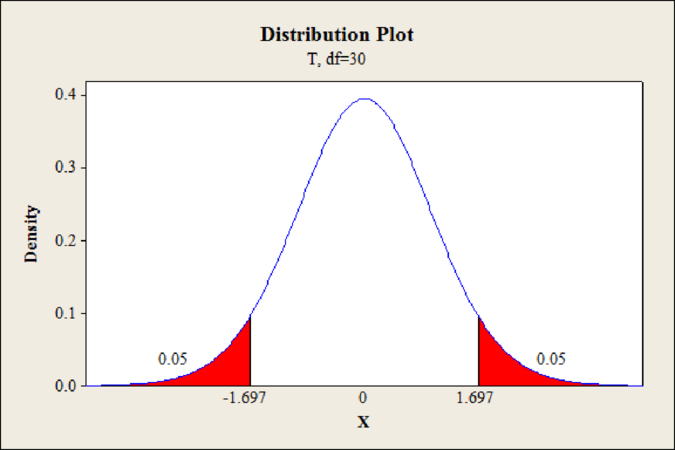
From the MINITAB output, the critical value is
The decision rule is,
If
If
b.
Find the value of the pooled estimate of the population variance.
Answer to Problem 8E
The pooled estimate of the population variance is 187.20.
Explanation of Solution
Calculation:
Pooled estimate:
The pooled estimate of the population variance is as follows:
Substitute
Thus, the pooled estimate of the population variance is 187.20.
c.
Find the value of test statistic.
Answer to Problem 8E
The value of the test statistic is 1.651.
Explanation of Solution
Test statistic:
The test statistic for the hypothesis test of
Substitute
Thus, the test statistic is 1.651.
d.
Determine the decision regarding
Answer to Problem 8E
The decision is fail to reject the null hypothesis.
Explanation of Solution
The critical value is 1.697 and the value of test statistic is 1.651.
The value of test statistic is less than the critical value.
That is,
From the decision rule, fail to reject the null hypothesis.
e.
Find the p-value.
Answer to Problem 8E
The p-value is 0.109.
Explanation of Solution
The p-value is obtained below:
Step-by-step procedure to obtain the p-value using MINITAB software:
- 1. Choose Graph > Probability Distribution Plot choose View Probability > OK.
- 2. From Distribution, choose ‘t’ distribution.
- 3. In Degrees of freedom, enter 30.
- 4. Click the Shaded Area tab.
- 5. Choose X Value and Two Tail for the region of the curve to shade.
- 6. Enter the X value as 1.651.
- 7. Click OK.
Output obtained using MINITAB software is given below:
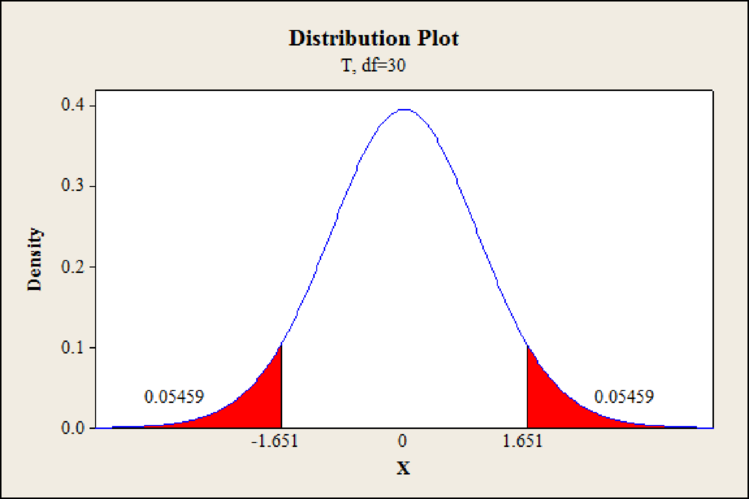
From the MINITAB output, the p-value for one side is 0.05459.
Thus, the p-value is 0.109.
Want to see more full solutions like this?
Chapter 11 Solutions
Statistical Techniques in Business and Economics 17th Edition (QCC Edition - No Access Code)


- For the T-test of the single sample, does the GPA of a group of students who were considered gifted in primary school is higher than the university's mean GPA? How do you state your hypothesis and then how do you decide based on the t-test if we should reject the null hypothesis?arrow_forwardThe management of the Seaside Golf Club regularly monitors the golfers on its course for speed of play. Suppose a random sample of golfers was taken in 2005 and another random sample of golfers was selected in 2006. The results of the two samples are as follows: 2005 2006 x1= 225 x2= 219 s1= 20.25 s2= 21.70 n1= 36 n2= 31 Based on the sample results, can the management of the Seaside Golf Course conclude that the average speed of play was different in 2006 than in 2005? Conduct the appropriate hypothesis test at the 0.10 level of significance. Assume that the management of the club is willing to accept the assumption that the populations of playing times for each year are approximately normally distributed.arrow_forwardIn each of Exercises, suppose that you want to perform a hypothesis test for a population mean. Assume that the population standard deviation is unknown and that the sample size is relatively small. In each exercise, we have given the distribution shape of the variable under consideration. Decide whether you would use the t- test, the Wilcoxon signedrank test, or neither. Explain your answers. Uniformarrow_forward
- Daily anxiety was measured on a scale from 1 (not at all anxious) to 5 (very anxious) in a random sample of 2000 city dwellers from across the U.S. They found that M = 4.13, 95% CIs [4.06, 4.20].How would you interpret these results? What conclusions would you draw about the precision of the point estimate? What statistical decision would have been made in this scenario if the researchers employed Null Hypothesis Significance Testing instead of the New Stats?arrow_forwardMorgan wants to test the speed for two different routes she can take to ride her bicycle home from work. Route A involves riding her bicycle on a busy road, and Route B involves riding her bicycle along a scenic trail. Assume that the population variances are not equal. Morgan collects some data, given below:Route A: xA=17.1 minutes, sA=4.6 minutes, nA=33 Route B: xB=15.8 minutes, sB=4.2 minutes, nB=39 ________________________________________________________________________________ a. Calculate the p-value of the hypothesis test, rounded to 4 decimal places. b. Come to a conclusion at the 0.05 significance level:arrow_forwardQ4. The evidence against the null hypothesis mounts as the p-value gets: A. Larger and larger B. Smaller and smallerarrow_forward
 MATLAB: An Introduction with ApplicationsStatisticsISBN:9781119256830Author:Amos GilatPublisher:John Wiley & Sons Inc
 Probability and Statistics for Engineering and th...StatisticsISBN:9781305251809Author:Jay L. DevorePublisher:Cengage Learning
 Statistics for The Behavioral Sciences (MindTap C...StatisticsISBN:9781305504912Author:Frederick J Gravetter, Larry B. WallnauPublisher:Cengage Learning
 Elementary Statistics: Picturing the World (7th E...StatisticsISBN:9780134683416Author:Ron Larson, Betsy FarberPublisher:PEARSON
 The Basic Practice of StatisticsStatisticsISBN:9781319042578Author:David S. Moore, William I. Notz, Michael A. FlignerPublisher:W. H. Freeman
 Introduction to the Practice of StatisticsStatisticsISBN:9781319013387Author:David S. Moore, George P. McCabe, Bruce A. CraigPublisher:W. H. Freeman