
Concept explainers
Videos
Returns and Standard Deviations Consider the following information:
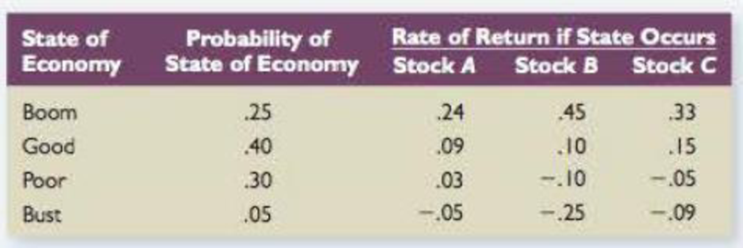
- a. Your portfolio is invested 30 percent each in A and C, and 40 percent in B. What is the expected return of the portfolio?
- b. What is the variance of this portfolio? The standard deviation?
a.
To determine: The Expected Return on Portfolio.
Introduction: Expected Return is a process of estimating the profits and losses an investor earns through the expected rate of returns. Standard deviation is apportioned of distribution of a collection of figures from its mean.
Answer to Problem 9QP
Solution: The Expected Return on Portfolio is 11.17%
Explanation of Solution
Determine the Portfolio Return for each Stock
Therefore the Portfolio Return for Boom is 35.10%, Good is 11.20%, Poor is -4.60% and Bust is -14.20%.
Determine the Expected Return on Portfolio
Therefore the Expected Return on Portfolio is 11.17%.
b.
To determine: The Variance and Standard Deviation on Portfolio.
Answer to Problem 9QP
Solution: The Variance on Portfolio is 0.025 and Standard Deviation on Portfolio is 15.81%.
Explanation of Solution
Determine the Variance of Portfolio
Therefore the Variance on Portfolio is 0.025.
Determine the Standard Deviation of Portfolio
Therefore the Standard Deviation on Portfolio is 15.81%.
Want to see more full solutions like this?
Chapter 11 Solutions
CORPORATE FIN.(LL)-W/ACCESS >CUSTOM<


- The following table reports the percentage of stocks in a portfolio for nine quarters: a. Construct a time series plot. What type of pattern exists in the data? b. Use trial and error to find a value of the exponential smoothing coefficient that results in a relatively small MSE. c. Using the exponential smoothing model you developed in part (b), what is the forecast of the percentage of stocks in a typical portfolio for the second quarter of year 3?arrow_forwardYou have observed the following returns over time: Assume that the risk-free rate is 6% and the market risk premium is 5%. What are the betas of Stocks X and Y? What are the required rates of return on Stocks X and Y? What is the required rate of return on a portfolio consisting of 80% of Stock X and 20% of Stock Y?arrow_forwardTwo-Asset Portfolio Stock A has an expected return of 12% and a standard deviation of 40%. Stock B has an expected return of 18% and a standard deviation of 60%. The correlation coefficient between Stocks A and B is 0.2. What are the expected return and standard deviation of a portfolio invested 30% in Stock A and 70% in Stock B?arrow_forward
- Suppose the risk-free rate is 5.1 percent and the market portfolio has an expected return of 11.8 percent. The market portfolio has a variance of .0472. Portfolio Z has a correlation coefficient with the market of .37 and a variance of .3375 According to the capital asset pricing model, what is the expected return on Portfolio Z?arrow_forwardCompute the weights in a portfolio consisting of two kinds of stock if the expected return on the portfolio is to be E(KV ) = 20%, given the following information on the returns on stock 1 and 2: Scenario ω1 (recession) Probability Return K1 Return K2 0.1 ω2 (stagnation) 0.5 ω3 (boom) 0.4 −10% 0% 20% 10% 20% 30% To compute the variance of KV we need to know not only the variances of the returns K1 and K2 on the components in the portfolio, but also the covariance between the two returns.arrow_forwardConsider the following information on a portfolio of three stocks: State of Economy Probability of State of Economy Stock A Rate of Return Stock B Rate of Return Stock C Rate of Return Boom.13.02.32.50 Normal.55.10.22.20 Bust .32.16.21.35 If your portfolio is invested 40 percent each in A and B and 20 percent in C, what is the portfolio's expected return, the variance, and the standard deviation? Note: Do not round intermediate calculations. Round your variance answer to 5 decimal places, e.g., 16161. Enter your other answers as a percent rounded to 2 decimal places, e. g., 32.16. If the expected T-bill rate is 4.25 percent, what is the expected risk premium on the portfolio? Note: Do not round intermediate calculations and enter your answer as a percent rounded to 2 decimal places, e. g., 32.16.arrow_forward
- Consider the following information on a portfolio of three stocks: State of Economy Probability of State of Economy Stock A Rate of Return Stock B Rate of Return Stock C Rate of Return Boom .25 .04 .33 .55 Normal .60 .09 .13 .19 Bust .15 .15 −.14 −.28 If your portfolio is invested 40 percent each in A and B and 20 percent in C, what is the portfolio’s expected return? The variance? The standard deviation? Note: Do not round intermediate calculations. Round your variance answer to 5 decimal places, e.g., .16161. Enter your other answers as a percent rounded to 2 decimal places, e.g., 32.16. If the expected T-bill rate is 3.4 percent, what is the expected risk premium on the portfolio? Note: Do not round intermediate calculations and enter your answer as a percent rounded to 2 decimal places, e.g., 32.16.arrow_forwardThe market index return is 1.3% and its standard deviation is 17%. The risk free rate is 3%. Portfolio Q generates an annual return of 14%, and has a beta of 1.35, and a standard deviation of 23%. Consider a complete portfolio that consists of the portfolio Q and the risk free asset. If we require the standard deviation of the complete portfolio to be the same as the market portfolio, what is the Sharpe ratio of the complete portfolio?arrow_forwardYou are constructing a portfolio of two assets, Asset A and Asset B. The expected returns of the assets are 12 percent and 15 percent, respectively. The standard deviations of the assets are 29 percent and 48 percent, respectively. The correlation between the two assets is .25 and the risk-free rate is 5 percent. What is the optimal Sharpe ratio in a portfolio of the two assets? What is the smallest expected loss for this portfolio over the coming year with a probability of 2.5 percent?arrow_forward
- An investment has probabilities 0.15, 0.34, 0.44, 0.67, 0.2 and 0.15 of giving returns equal to 50%, 39%, -4%, 20%, -25%, and 42%. What are the expected returns and the standard deviations of returns?arrow_forwardIf your portfolio is invested in 40% Alpha, 40% Beta, and 20% in Delta, what is the expected return of the portfolio? The variance of the portfolio? The standard deviation? Economy: boom,normal,bust Probability--25%,60%,15%. Alpha Stock Return: 13%,8%,2%. Beta returns: 29%,11%,-18.00%. Delta returns: 60%,13%,-45.00%arrow_forwardAssume that the following data available for the portfolio, calculate the expected return, variance and standard deviation of the portfolio given stock A accounts for 45% and stock B accounts for 55% of your portfolio? A B Expected return 12.5% 18.5% Standard Deviation of return 15% 20% Correlation of coefficient (p) 0.4arrow_forward

 Intermediate Financial Management (MindTap Course...FinanceISBN:9781337395083Author:Eugene F. Brigham, Phillip R. DavesPublisher:Cengage Learning
 EBK CONTEMPORARY FINANCIAL MANAGEMENTFinanceISBN:9781337514835Author:MOYERPublisher:CENGAGE LEARNING - CONSIGNMENT

 Essentials of Business Analytics (MindTap Course ...StatisticsISBN:9781305627734Author:Jeffrey D. Camm, James J. Cochran, Michael J. Fry, Jeffrey W. Ohlmann, David R. AndersonPublisher:Cengage Learning