
Videos
(i)
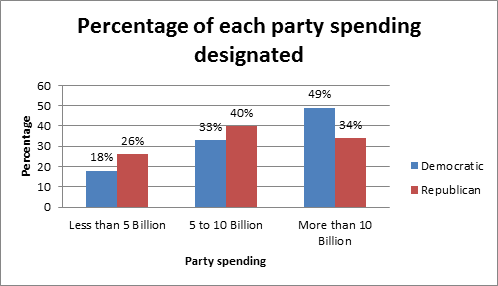
To graph: A cluster bar graph showing the percentages of Congress members from each party who spent each designated amount in their respective home districts.
(i)
Explanation of Solution
Calculation: To find the percentage table:
| Party | Less than 5 Billion | 5 to 10 Billion | More than 10 Billion |
| Democratic | |||
| Republican |
Graph: To create cluster bar graph by using Excel is as follows:
Step 1: Enter the percentage data table in Excel worksheet.
Step 2: Select table and go to Insert > Charts > Column.
The cluster bar graph is obtained as:
(ii)
(a)
The level of significance and state the null and alternative hypotheses.
(ii)
(a)
Answer to Problem 18P
Solution: The level of significance is 0.01.
Explanation of Solution
The level of significance,
The null hypothesis for testing is defined as,
The alternative hypothesis is defined as,
(b)
To test: Whether all the expected frequencies are greater than 5. Also determine the value of chi-square statistic for the sample, the sampling distribution that should be used and degrees of freedom for the test.
(b)
Answer to Problem 18P
Solution: The value of chi-square statistic for the sample,
Explanation of Solution
Calculation: The find the
Step 1: Go to Stat >Tables> Chi-square Test For Association.
Step 2: Select ‘Summarized data in two-way table’ and select <5B, 5-10B, >10Bin ‘Columns containing the table’ box.
Step 3: Select ‘Partyin ‘Rows’ and write any name in ‘Columns’ and click on ‘Statistics’ tick on Chi-square test and Expected cell counts. Then click on OK.
The Minitab output is:
Chi-Square Test for Association: Party, spent
Rows: Party Columns: spent
| <5B | 5-10B | >10B | |
| Democratic | 9.78 | 16.63 | 18.59 |
| Republican | 10.22 | 17.37 | 19.41 |
Cell Contents
Expected count
Chi-Square Test
| Chi-Square | DF | P-Value | |
| Pearson | 2.176 | 2 | 0.337 |
| Likelihood Ratio | 2.185 | 2 | 0.335 |
Therefore, the obtained Chi-square test statistics is 2.176.
The obtained expected frequencies are:
| Party | <5B | 5-10B | >10B |
| Democratic | 9.78 | 16.63 | 18.59 |
| Republican | 10.22 | 17.37 | 19.41 |
So, all expected frequencies are greater than 5.
The chi-square distribution should be used in this study and the obtained degrees of freedom are 2.
(c)
The P-value of the sample statistic.
(c)
Answer to Problem 18P
Solution: The P-value of sample statistic is 0.337.
Explanation of Solution
Calculation: The Minitab output obtained in above part (b) also gives the P-value. So, the P-value for the sample test statistic is 0.337.
(d)
To explain: Whether we will reject or fails to reject the null hypothesis.
(d)
Answer to Problem 18P
Solution: We failed to reject the null hypothesis at significance level 0.05.
Explanation of Solution
The obtained results in part (a), (b) and (c) are,
Since the P-value (0.337) is greater than 0.01, hence we failed to reject the null hypothesis of independence at
(e)
To explain: The conclusion in the context of application.
(e)
Answer to Problem 18P
Solution: It is concluded that the Stone tools construction material and sitearenot independent.
Explanation of Solution
From above part, it can be seen that we failed to reject the null hypothesis at
Therefore, at the 1% level of significance, there is sufficient evidence to conclude that congressional members of each political party spent designated amounts in the same proportions.
Want to see more full solutions like this?
Chapter 11 Solutions
UNDERSTANDING BASIC STAT LL BUND >A< F


 MATLAB: An Introduction with ApplicationsStatisticsISBN:9781119256830Author:Amos GilatPublisher:John Wiley & Sons Inc
 Probability and Statistics for Engineering and th...StatisticsISBN:9781305251809Author:Jay L. DevorePublisher:Cengage Learning
 Statistics for The Behavioral Sciences (MindTap C...StatisticsISBN:9781305504912Author:Frederick J Gravetter, Larry B. WallnauPublisher:Cengage Learning
 Elementary Statistics: Picturing the World (7th E...StatisticsISBN:9780134683416Author:Ron Larson, Betsy FarberPublisher:PEARSON
 The Basic Practice of StatisticsStatisticsISBN:9781319042578Author:David S. Moore, William I. Notz, Michael A. FlignerPublisher:W. H. Freeman
 Introduction to the Practice of StatisticsStatisticsISBN:9781319013387Author:David S. Moore, George P. McCabe, Bruce A. CraigPublisher:W. H. Freeman