
Numerical Analysis
3rd Edition
ISBN: 9780134696454
Author: Sauer, Tim
Publisher: Pearson,
expand_more
expand_more
format_list_bulleted
Concept explainers
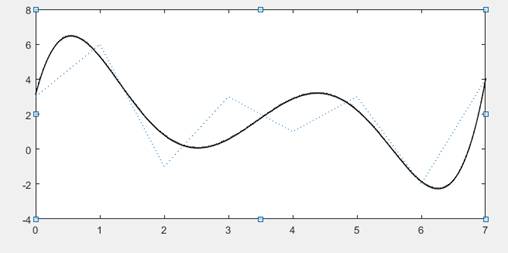
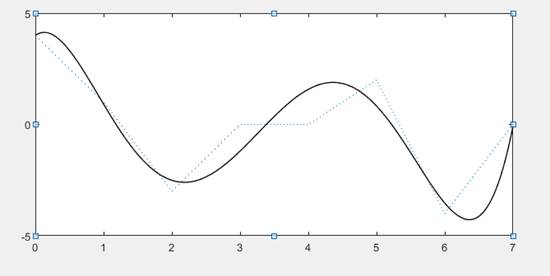
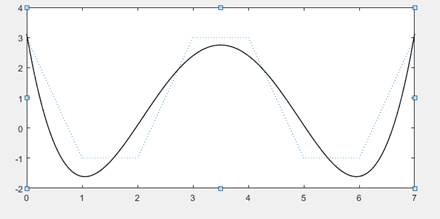
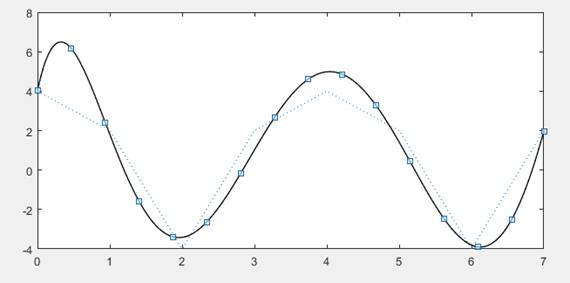
Videos
Textbook Question
Chapter 11.1, Problem 2CP
Plot the data along with the
Expert Solution & Answer
Want to see the full answer?
Check out a sample textbook solution
Chapter 11 Solutions
Numerical Analysis
Ch. 11.1 - Use the 22 DCT matrix and Theorem 11.2 to find the...Ch. 11.1 - Prob. 2ECh. 11.1 - Prob. 3ECh. 11.1 - Prob. 4ECh. 11.1 - Prob. 5ECh. 11.1 - (a) Prove the trigonometric formula...Ch. 11.1 - Prob. 7ECh. 11.1 - Plot the data from Exercise 3, along with the DCT...Ch. 11.1 - Plot the data along with the m=4,6, and 8 DCT...Ch. 11.1 - Plot the function f(t), the data points...
Ch. 11.2 - Prob. 1ECh. 11.2 - Prob. 2ECh. 11.2 - Prob. 3ECh. 11.2 - Use the quantization matrix Q=[ 102020100 ] to...Ch. 11.2 - Prob. 1CPCh. 11.2 - Prob. 2CPCh. 11.2 - Obtain a grayscale image file of your choice, and...Ch. 11.2 - Carry out the steps of Computer Problem 3, but...Ch. 11.2 - Obtain a color image file of your choice. Carry...Ch. 11.2 - Prob. 6CPCh. 11.3 - Prob. 1ECh. 11.3 - Prob. 2ECh. 11.3 - Draw a Huffman tree and convert the message,...Ch. 11.3 - Translate the transformed, quantized image...Ch. 11.4 - Prob. 1ECh. 11.4 - Prob. 2ECh. 11.4 - Prob. 3ECh. 11.4 - Prob. 4ECh. 11.4 - Prob. 5ECh. 11.4 - Prob. 6ECh. 11.4 - Prob. 7ECh. 11.4 - Prob. 8ECh. 11.4 - Prob. 9ECh. 11.4 - Prob. 10ECh. 11.4 - Prob. 1CPCh. 11.4 - Prob. 2CPCh. 11.4 - Prob. 1SACh. 11.4 - Prob. 2SACh. 11.4 - Prob. 3SACh. 11.4 - Prob. 4SACh. 11.4 - Prob. 5SACh. 11.4 - Prob. 6SACh. 11.4 - Build two separate subprograms, a coder and a...
Knowledge Booster


Learn more about
Need a deep-dive on the concept behind this application? Look no further. Learn more about this topic, subject and related others by exploring similar questions and additional content below.Recommended textbooks for you
 Linear Algebra: A Modern IntroductionAlgebraISBN:9781285463247Author:David PoolePublisher:Cengage Learning
 Glencoe Algebra 1, Student Edition, 9780079039897...AlgebraISBN:9780079039897Author:CarterPublisher:McGraw Hill
 Elementary Linear Algebra (MindTap Course List)AlgebraISBN:9781305658004Author:Ron LarsonPublisher:Cengage Learning
Linear Algebra: A Modern Introduction
Algebra
ISBN:9781285463247
Author:David Poole
Publisher:Cengage Learning
Glencoe Algebra 1, Student Edition, 9780079039897...
Algebra
ISBN:9780079039897
Author:Carter
Publisher:McGraw Hill
Elementary Linear Algebra (MindTap Course List)
Algebra
ISBN:9781305658004
Author:Ron Larson
Publisher:Cengage Learning
Correlation Vs Regression: Difference Between them with definition & Comparison Chart; Author: Key Differences;https://www.youtube.com/watch?v=Ou2QGSJVd0U;License: Standard YouTube License, CC-BY
Correlation and Regression: Concepts with Illustrative examples; Author: LEARN & APPLY : Lean and Six Sigma;https://www.youtube.com/watch?v=xTpHD5WLuoA;License: Standard YouTube License, CC-BY