
Concept explainers
Videos
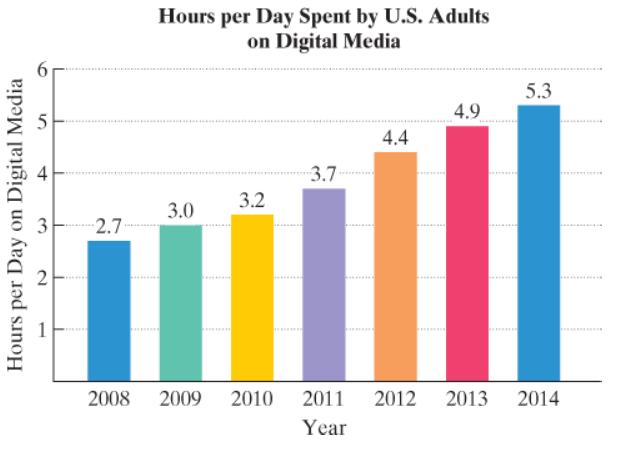
The bar graph shows the average number of hours per day that US. adult users spent on digital media (desktop/laptop, mobile, and other devices) from 2008 through 2014.
Let
years after 2007.
a. Use the numbers given in the graph to find and interpret
b. The finite sequence whose general term is
where
Want to see the full answer?
Check out a sample textbook solution
Chapter 11 Solutions
Intermediate Algebra for College Students - Learning Guide


 Algebra & Trigonometry with Analytic GeometryAlgebraISBN:9781133382119Author:SwokowskiPublisher:Cengage
 Glencoe Algebra 1, Student Edition, 9780079039897...AlgebraISBN:9780079039897Author:CarterPublisher:McGraw Hill
 College Algebra (MindTap Course List)AlgebraISBN:9781305652231Author:R. David Gustafson, Jeff HughesPublisher:Cengage Learning