Concept explainers
Videos
(a)
To calculate: ANOVA table
(a)
Answer to Problem 11.55E
| Source | dF | SS | MS | F |
| Training | 1 | 4489.00 | 4489.00 | 117.49 |
| Situation | 1 | 132.25 | 132.25 | 3.46 |
| Interaction | 1 | 56.25 | 56.25 | 1.47 |
| Error | 12 | 458.50 | 38.21 | |
| Total | 15 | 5136.00 |
Explanation of Solution
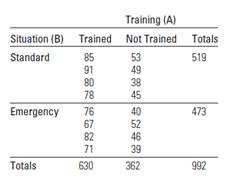
Given:
Calculation:
Therefore,
Value of total SS is,
Total
Value of the sum of the squares of factor A is,
Value of the sum of the squares of factor B is,
Value of the sum of the squares of factor A and B is,
Hence,
MSA is SSA divided by
MSB is SSB divided by
MS(AB) is SS(AB) divided by
MSE is SSE divided by
The value of the test statistic F is then MST divided by MSE:
| Source | dF | SS | MS | F |
| Training | 1 | 4489.00 | 4489.00 | 117.49 |
| Situation | 1 | 132.25 | 132.25 | 3.46 |
| Interaction | 1 | 56.25 | 56.25 | 1.47 |
| Error | 12 | 458.50 | 38.21 | |
| Total | 15 | 5136.00 |
(b)
To calculate: is there a significant interaction between the presence or absence of training and the type of decision making situation.
(b)
Answer to Problem 11.55E
Explanation of Solution
Given:
Data observations given in exercise 11.54
Calculation:
Now, we want to test the data provide sufficient interaction between the presence of absence of training and the type of decision-making situation using
Now, test the hypotheses.
The null hypothesis:
Versus the alternative hypothesis:
The test statistic is given by,
Where
Rejection region:
Using the critical value approach with
since the observed value,
No, there is no sufficient evidence to indicate that the two factors
Conclusion:
Therefore,
(c)
To calculate: whether there is a difference in behaviour ratings for two types of situation at 5% level of significance.
(c)
Answer to Problem 11.55E
There is no sufficient evidence to indicate that at least two of the factor a means differ.
Explanation of Solution
Given:
Data observations given in exercise 11.54
Calculation:
Now, we want to test the data provide sufficient evidence to indicate a significance difference in
behavior ratings for the two types of situations at the
Now, test the hypotheses,
Versus the alternative hypothesis
The test statistic is given by,
Where
We have given,
The test statistic is given by,
Rejection region:
Using the critical value approach with
since the observed value,
Conclusion:
Therefore, there is no sufficient evidence to indicate that at least two of the factor a means differ.
(c)
To calculate: Whether there is a difference in behavior ratings for two types of the situation at 5% level of significance.
(c)
Answer to Problem 11.55E
There is no sufficient evidence to indicate that at least two of the factor a means differ.
Explanation of Solution
Given:
Data observations given in exercise 11.54
Calculation:
Now, we want to test the data provide sufficient evidence to indicate a significant difference in
behavior ratings for the two types of situations at the
Now, test the hypotheses,
Versus the alternative hypothesis
The test statistic is given by,
Where
We have given,
The test statistic is given by,
Rejection region:
Using the critical value approach with
since the observed value,
Conclusion:
Therefore, there is no sufficient evidence to indicate that at least two of the factor a means differ.
(d)
To calculate: whether there is a difference in behaviour ratings for two types of situation at 5% level of significance.
(d)
Answer to Problem 11.55E
There is sufficient evidence to indicate that at least two of the factor b means differ.
Explanation of Solution
Given:
Data observations are given in exercise 11.54
Calculation:
Now, we want to test the data provide sufficient evidence to indicate a significant for the two types of training categories at the
Now, test the hypotheses,
Versus the alternative hypothesis
The test statistic is given by,
Where
We have given,
The test statistic is given by,
Rejection region:
Using the critical value approach with
F tabulated values.
since the observed value,
Conclusion:
Therefore, there is sufficient evidence to indicate that at least two of the factor b means differ.
(e)
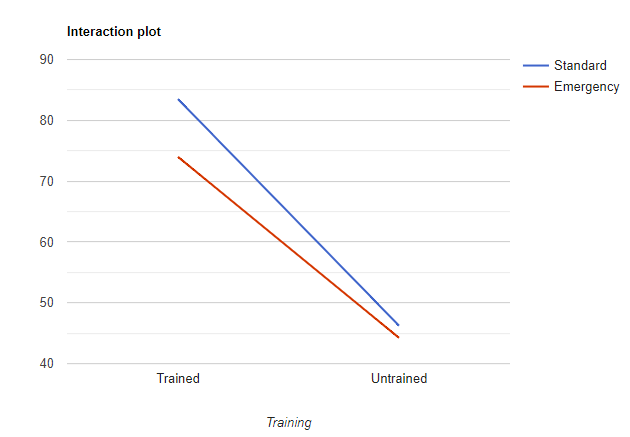
To plot: the average scores using an interaction plot
(e)
Answer to Problem 11.55E
Average score plot is drawn
The mean response is higher for the trained supervisors compared to the untrained supervisors, while the mean response appears to be slightly higher overall for the standard situation.
Explanation of Solution
Given:
Data observations are given in exercise 11.54
Calculation:
 Therefore, there is no relationship between the two factors
Conclusion:
Therefore, Average score plot is drawn
The mean response is higher for the trained supervisors compared to the untrained supervisors, while the mean response appears to be slightly higher overall for the standard situation.
Want to see more full solutions like this?
Chapter 11 Solutions
EBK INTRODUCTION TO PROBABILITY AND STA


 Glencoe Algebra 1, Student Edition, 9780079039897...AlgebraISBN:9780079039897Author:CarterPublisher:McGraw Hill
 College Algebra (MindTap Course List)AlgebraISBN:9781305652231Author:R. David Gustafson, Jeff HughesPublisher:Cengage Learning