Statistics For Business And Economics, Student Value Edition Plus Mystatlab With Pearson Etext -- Access Card Package (13th Edition)
13th Edition
ISBN: 9780134596846
Author: MCCLAVE
Publisher: PEARSON
expand_more
expand_more
format_list_bulleted
Concept explainers
Videos
Textbook Question
Chapter 11.2, Problem 11.15LM
Refer to Exercise 11.14. After the least squares line has been obtained, the table below (which is similar to Table 11.2 can be used for (1) comparing the observed and the predicted values of y and (2) computing SSE
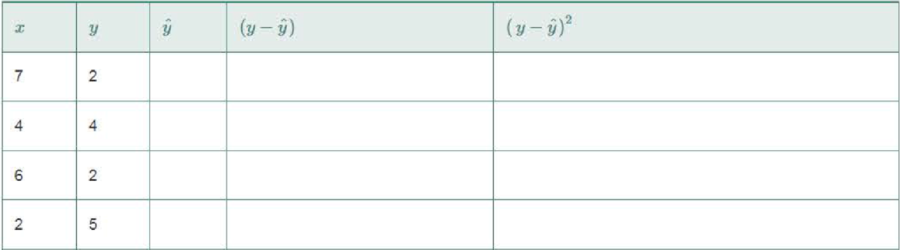
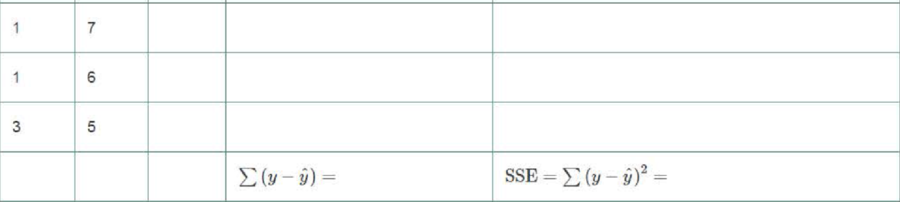
a. Complete the table.
b. Plot the least squares line on a
c. Show that SSE is larger for the line in part b than it is for the least squares line.
Expert Solution & Answer
Want to see the full answer?
Check out a sample textbook solution
Students have asked these similar questions
How many indicator variables would be included in the model in order to prevent the least squares estimation from failing?
The regional transit authority for a major metropolitan area wants to determine whetherthere is any relationship between the age of a bus and the annual maintenance cost. Asample of 10 buses resulted in the following data.
Age of Bus (year)
Maintenance Cost ($)
1
350
2
370
2
480
2
520
2
590
3
550
4
750
4
800
5
790
5
950
a. Develop the least squares estimated regression equation.b. Test to see whether the two variables are significantly related with α = .5.c. Did the least squares line provide a good fit to the observed data? Explain.d. Develop a 95% prediction interval for the maintenance cost for a specific bus thatis 4 years old.
The following table shows the percent of water and the number of calories in various canned soups to which 100 g of water are added. (show all the necessary solution) Percent Water in Soups % Water Calories 83.3 28 92.3 26 91.9 39 89.4 57 89.5 57 90.5 36 91.9 32 91.7 32 a. Find the equation of the least squares line for the data. b. Use the equation in part a to find the expected number of calories in a soup that is 87% water. c. Determine the correlation coefficient of the data.
Chapter 11 Solutions
Statistics For Business And Economics, Student Value Edition Plus Mystatlab With Pearson Etext -- Access Card Package (13th Edition)
Ch. 11.1 - In each case, graph the line that passes through...Ch. 11.1 - Give the slope and y-intercept for each of the...Ch. 11.1 - The equation for a straight line (deterministic...Ch. 11.1 - Refer to Exercise 11.3. Find the equations of the...Ch. 11.1 - Plot the following lines: a. y 4 + x b. y = 5 2x...Ch. 11.1 - Give the slope and y-intercept for each of the...Ch. 11.1 - Prob. 11.7LMCh. 11.1 - Prob. 11.8LMCh. 11.1 - If a straight-line probabilistic relationship...Ch. 11.1 - Congress voting on women's issues. The American...
Ch. 11.1 - Best-paid CEOs. Refer to Glassdoor Economic...Ch. 11.1 - Estimating repair and replacement costs of water...Ch. 11.1 - Forecasting movie revenues with Twitter. A study...Ch. 11.2 - The following table is similar to Table 11.2.It is...Ch. 11.2 - Refer to Exercise 11.14. After the least squares...Ch. 11.2 - Construct a scatterplot for the data in the...Ch. 11.2 - Consider the following pairs of measurements: a....Ch. 11.2 - Use the applet Regression by Eye to explore the...Ch. 11.2 - In business, do nice guys finish first or last?...Ch. 11.2 - State Math SAT scores. Refer to the data on...Ch. 11.2 - Lobster fishing study. Refer to the Bulletin of...Ch. 11.2 - Repair and replacement costs of water pipes. Refer...Ch. 11.2 - Joint Strike Fighter program. The Joint Strike...Ch. 11.2 - Software millionaires and birthdays. In Outliers:...Ch. 11.2 - Prob. 11.24ACICh. 11.2 - Ranking driving performance of professional...Ch. 11.2 - Sweetness of orange juice. The quality of the...Ch. 11.2 - Forecasting movie revenues with Twitter. Marketers...Ch. 11.2 - Charisma of top-level leaders. According to a...Ch. 11.2 - Ran kings of research universities. Refer to the...Ch. 11.2 - Prob. 11.30ACACh. 11.3 - Visually compare the scatterplots shown below. If...Ch. 11.3 - Calculate SSE and s2 for each of the following...Ch. 11.3 - Suppose you fit a least squares line to 26 data...Ch. 11.3 - Refer to Exercise 11.14 (p. 629). Calculate SSE,...Ch. 11.3 - Do nice guys really finish last in business? Refer...Ch. 11.3 - State Math SAT scores. Refer to the simple linear...Ch. 11.3 - Prob. 11.37ACBCh. 11.3 - Prob. 11.38ACBCh. 11.3 - Prob. 11.39ACBCh. 11.3 - Prob. 11.40ACICh. 11.3 - Prob. 11.41ACICh. 11.3 - Sweetness of orange juice. Refer to the study of...Ch. 11.3 - Rankings of research universities. Refer to the...Ch. 11.3 - Life tests of cutting tools. To Improve the...Ch. 11.4 - Construct both a 95% and a 90% confidence interval...Ch. 11.4 - Consider the following pairs of observations: a....Ch. 11.4 - Refer to Exercise 11.46. Construct an 80% and a...Ch. 11.4 - Do the accompanying data provide sufficient...Ch. 11.4 - State Math SAT Scores. Refer to the SPSS simple...Ch. 11.4 - Lobster fishing study. Refer to the Bulletin of...Ch. 11.4 - Prob. 11.51ACBCh. 11.4 - Prob. 11.52ACBCh. 11.4 - Estimating repair and replacement costs of water...Ch. 11.4 - Prob. 11.54ACBCh. 11.4 - Prob. 11.55ACICh. 11.4 - Beauty and electoral success. Are good looks an...Ch. 11.4 - Prob. 11.57ACICh. 11.4 - Prob. 11.58ACICh. 11.4 - Prob. 11.59ACICh. 11.4 - Prob. 11.60ACICh. 11.4 - Rankings of research universities. Refer to the...Ch. 11.4 - Prob. 11.62ACACh. 11.4 - Does elevation impact hitting performance in...Ch. 11.5 - Explain what each of the following sample...Ch. 11.5 - Describe the slope of the least squares line if a....Ch. 11.5 - Construct a scatterplot for each data set. Then...Ch. 11.5 - Calculate r2 for the least squares line in each of...Ch. 11.5 - Use the applet Correlation by Eye to explore the...Ch. 11.5 - In business, do nice guys finish first or last?...Ch. 11.5 - Going for it on fourth-down in the NFL Each week...Ch. 11.5 - Lobster fishing study. Refer to the Bulletin of...Ch. 11.5 - RateMyProfessors.com. A popular Web site among...Ch. 11.5 - Last name and acquisition timing. Refer to the...Ch. 11.5 - Women in top management. An empirical analysis of...Ch. 11.5 - Prob. 11.74ACICh. 11.5 - Prob. 11.75ACICh. 11.5 - Prob. 11.76ACICh. 11.5 - Prob. 11.77ACICh. 11.5 - Prob. 11.78ACICh. 11.5 - Evaluation of an imputation method for missing...Ch. 11.5 - Prob. 11.80ACICh. 11.5 - Prob. 11.81ACACh. 11.6 - Consider the followings of measurements: a...Ch. 11.6 - Consider the pairs of measurements shown in the...Ch. 11.6 - In fitting a least squares line to n = 10 data...Ch. 11.6 - Prob. 11.86ACBCh. 11.6 - Prob. 11.87ACBCh. 11.6 - Prob. 11.88ACBCh. 11.6 - Prob. 11.89ACBCh. 11.6 - Prob. 11.90ACBCh. 11.6 - Prob. 11.91ACICh. 11.6 - Ranking driving performance of professional...Ch. 11.6 - Spreading rate of spilled liquid Refer to the...Ch. 11.6 - Removing nitrogen from toxic wastewater. Highly...Ch. 11.6 - Predicting quit rates In manufacturing The reasons...Ch. 11.6 - Life tests of cutting tools Refer to the data...Ch. 11.7 - Prices of recycled materials. Prices of recycled...Ch. 11.7 - Thickness of dust on solar cells. The performance...Ch. 11.7 - Management research In Africa. The editors of the...Ch. 11.7 - An MBAs work-life balance. The importance of...Ch. 11 - In fitting a least squares line ton= 15 data...Ch. 11 - Consider the following sample data. a. Construct a...Ch. 11 - Consider the following 10 data points. a. Plot the...Ch. 11 - Drug controlled-release rate study. The effect of...Ch. 11 - Metaskills and career management. Effective...Ch. 11 - Burnout of human services professionals. Emotional...Ch. 11 - Retaliation against company whistle-blowers....Ch. 11 - Extending the life of an aluminum smelter pot. An...Ch. 11 - Diamonds sold at retail. Refer to the Journal of...Ch. 11 - Sports news on local TV broadcasts. The Sports...Ch. 11 - Evaluating managerial success. An observational...Ch. 11 - Doctors and ethics. Refer to the Journal of...Ch. 11 - FCAT scores and poverty. In the state of Florida,...Ch. 11 - Monetary values of NFL teams. Refer to the Forbes...Ch. 11 - Evaluating a truck weigh-in-motion program. The...Ch. 11 - Energy efficiency of buildings. Firms conscious of...Ch. 11 - Forecasting managerial needs. Managers are an...Ch. 11 - Prob. 11.118ACACh. 11 - Prob. 11.119CTCCh. 11 - Prob. 11.120CTC
Knowledge Booster


Learn more about
Need a deep-dive on the concept behind this application? Look no further. Learn more about this topic, statistics and related others by exploring similar questions and additional content below.Similar questions
- A chemical company, seeking to study the effect of extraction time on the efficiency of an extraction operation, obtained the data from a table: Fit a straight line to the data given with the least squares method and use it to predict the extraction efficiency that would be expected when the extraction time is 35 minutes. x = Extraction time (minutes)y = Extraction efficiency (%)arrow_forwardEx[lain the Two Stage Least Squares Estimator?arrow_forward1. Prior to being hired, the ve salespersons for a computer store were given a standard sales aptitude test. For each individual, the score achieved on the aptitude test and the number of computer systems sold during the first 3 months of their employment are shown in the attached image. (a) Determine the least-squares regression line and interpret its slope. (b) Estimate, for a new employee who scores 60 on the sales aptitude test, the number of units the new employee will sell in her first 3 months with the company. (c) Find the standard error of estimate. (d) Find the r-square of the model.arrow_forward
- Suppose a least-squares regression line is given by y=4.302x−3.293. What is the mean value of the response variable if x=20? μy20=_______? (Round to one decimal place as needed.)arrow_forwardA regression line was calculated to relate the length (cm) of newborn boys to their weight in kg. The least squares regression line is weight = -5.94 + 0.1875 length. Explain in words what this model means (slop and intercept) The new- born boy was 48 cm long, what is the predicted weight of this boy? It is known that the boy is weighed 3 kg. what was his residual? What does that say about him?arrow_forwardAn article included a summary of findings regarding the use of SAT I scores, SAT II scores, and high school grade point average (GPA) to predict first-year college GPA. The article states that "among these, SAT II scores are the best predictor, explaining 17 percent of the variance in first-year college grades. GPA was second at 15.2 percent, and SAT I was last at 13.1 percent." If the data from this study were used to fit a least squares line with y = first-year college GPA and x = high school GPA, what would the value of r2 have been? R2 ____________________%arrow_forward
- A year-long fitness center study sought to determine if there is a relationship between the amount of muscle mass gained y(kilograms) and the weekly time spent working out under the guidance of a trainer x(minutes). The resulting least-squares regression line for the study is y=2.04 + 0.12x A) predictions using this equation will be fairly good since about 95% of the variation in muscle mass can be explained by the linear relationship with time spent working out. B)Predictions using this equation will be faily good since about 90.25% of the variation in muscle mass can be explained by the linear relationship with time spent working out C)Predictions using this equation will be fairly poor since only about 95% of the variation in muscle mass can be explained by the linear relationship with time spent working out D) Predictions using this equation will be fairly poor since only about 90.25% of the variation in muscle mass can be explained by the linear relationship with time spent…arrow_forwardWhat is the least-squares line approximation to a set of datapoints? How is the line determined?arrow_forwardThe y-interept bo of a least-squares regression line has a useful interpretation only if the x-values are either all positive or all negative. Determine if the statement is true or false. Why? If the statement is false, rewrite as a true statement.arrow_forward
- In a random sample of pediatric patients at a local hospital, the age of a patient and the patient's height have a correlation of 0.8. If we use the age of the patients to predict their height, which of the following is a correct statement? a Sixty-four percent of the time, the least squares regression line accurately predicts height. b About 80% of a person's height can be explained by age, according to the regression line relating height and age. c Sixty-four percent of the variation in height can be explained by the variation in the age of a patient. d The least squares regression line relating height to age will have a slope of approximately 0.8. e About 80% of the time, age will correctly predict the height.arrow_forwardWhen we use a least-squares line to predict y values for x values beyond the range of x values found in the data, are we extrapolating or interpolating? Are there any concerns about such predictions?arrow_forwardDetermine the best (according to sum-of-squares-measure) curve y = Aebx, through the dataabove.Transformed equationln(y) = ln(A) + bxorY = a + bx.arrow_forward
arrow_back_ios
arrow_forward_ios
Recommended textbooks for you
 Linear Algebra: A Modern IntroductionAlgebraISBN:9781285463247Author:David PoolePublisher:Cengage Learning
Linear Algebra: A Modern Introduction
Algebra
ISBN:9781285463247
Author:David Poole
Publisher:Cengage Learning
Correlation Vs Regression: Difference Between them with definition & Comparison Chart; Author: Key Differences;https://www.youtube.com/watch?v=Ou2QGSJVd0U;License: Standard YouTube License, CC-BY
Correlation and Regression: Concepts with Illustrative examples; Author: LEARN & APPLY : Lean and Six Sigma;https://www.youtube.com/watch?v=xTpHD5WLuoA;License: Standard YouTube License, CC-BY