Concept explainers
Videos
Construct a
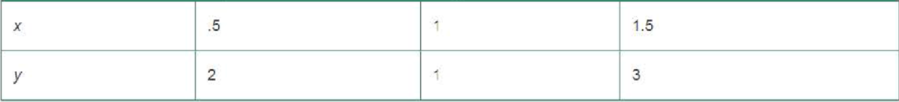
a. Plot the following two lines on your scatterplot:
b. Which of these lines would you choose to characterize the relationship between x and y? Explain.
c. Show that the sum of the errors of prediction for both of these lines equals 0.
d. Which of these lines has the smaller SSE?
e. Find the least squares line for the data and compare it with the two lines described in part a.
Want to see the full answer?
Check out a sample textbook solution
Chapter 11 Solutions
Statistics for Business and Economics Plus MyLab Statistics with Pearson eText -- Title-Specific Access Card Package (13th Edition)


 Linear Algebra: A Modern IntroductionAlgebraISBN:9781285463247Author:David PoolePublisher:Cengage Learning