
Thinking Like an Engineer: An Active Learning Approach (4th Edition)
4th Edition
ISBN: 9780134639673
Author: Elizabeth A. Stephan, David R. Bowman, William J. Park, Benjamin L. Sill, Matthew W. Ohland
Publisher: PEARSON
expand_more
expand_more
format_list_bulleted
Concept explainers
Videos
Textbook Question
Chapter 11.2, Problem 1CC
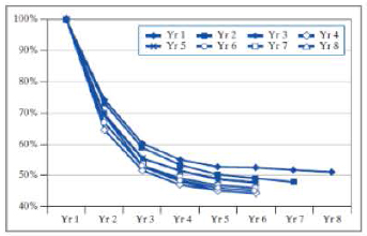 In the following experimental data plot, identify violations of the proper plot rules.
Expert Solution & Answer
Want to see the full answer?
Check out a sample textbook solution
Students have asked these similar questions
What is the 95% confidence interval for each of the three measured parameters?
A work measurement analyst at the Dorben Company took 10 observations of a high-production job. He rated the performance of each cycle and then calculated the average normal time for each item. The item with the largest dispersion had a mean of 0.30 minutes and a standard deviation of 0.03 minutes. If it is desired to have sample data within ±5% of the actual data, how many observations should the time study analyst take of this operation?
In most cases a validation of the estimate is a sanity check' to ensure that the estimate is reasonable. What strategies and processes are used to
conduct a validation of an estimate? Provide a brief explanation of each. (50-80 words)
Chapter 11 Solutions
Thinking Like an Engineer: An Active Learning Approach (4th Edition)
Ch. 11.2 - In the following experimental data plot, identify...Ch. 11.2 - In the following experimental data plot, identify...Ch. 11.2 - In the following theoretical data plot, identify...Ch. 11.2 - In the following theoretical data plot, identify...Ch. 11.4 - Use the graph to answer the following questions....Ch. 11.5 - Use the graph to answer the following questions....Ch. 11.6 - We assume that the current through two...Ch. 11.6 - You are working for a tire manufacturer, producing...Ch. 11.6 - You want to install a solar panel system on your...Ch. 11 - Joules first law relates the heat generated to...
Ch. 11 - Data for a wind turbine is shown below. Use the...Ch. 11 - There is a large push in the United States to...Ch. 11 - Your team has designed three tennis ball...Ch. 11 - Plot the following pairs of functions on a single...Ch. 11 - Plot the following pairs of functions on a single...Ch. 11 - You need to create a graph showing the...Ch. 11 - The decay of a radioactive isotope can be modeled...Ch. 11 - In researching alternate energies, you find that...Ch. 11 - The following graph applies to ICA 11-10 to ICA...Ch. 11 - The following graph applies to ICA 11-10 to ICA...Ch. 11 - The following graph applies to ICA 11-10 to ICA...Ch. 11 - The following graph applies to ICA 11-10 to ICA...Ch. 11 - The following graph applies to ICA 11-10 to ICA...Ch. 11 - The following graph applies to ICA 11-10 to ICA...Ch. 11 - Use the following graph to determine which...Ch. 11 - The following graph shows the power delivered to a...Ch. 11 - The music industry in the United States has had a...Ch. 11 - You are working for a chemical manufacturer,...Ch. 11 - Use the accompanying graph to answer the following...Ch. 11 - A company designs submersible robots with a new...Ch. 11 - Your company is manufacturing a complex part from...Ch. 11 - For questions 1 through 10, your instructor will...Ch. 11 - 2. Due to increased demand, an industrial engineer...Ch. 11 - 3. An engineer is conducting tests of two...Ch. 11 - 4. Several reactions are carried out in a closed...Ch. 11 - 5. The following experimental data are collected...Ch. 11 - 6. If an object is heated, the temperature of the...Ch. 11 - 7. Eutrophication is the result of excessive...Ch. 11 - 8. In the 1950s, a team at Los Alamos National...Ch. 11 - Prob. 9RQCh. 11 - 10. One of the 22 named, derived units in the...Ch. 11 - Shown are graphs of the altitude in meters, and...Ch. 11 - Answer the following questions using the graph....Ch. 11 - Answer the following questions using the graph....Ch. 11 - In a simple electric circuit, the current (I) must...Ch. 11 - In a hard drive design, the faster the disk spins,...Ch. 11 - We have decided to become entrepreneurs by raising...Ch. 11 - As an engineer, suppose you are directed to design...Ch. 11 - We have obtained a contract to construct metal...Ch. 11 - Your company has developed a new high-mileage...Ch. 11 - One of the 14 Grand Challenges for Engineering as...Ch. 11 - You are an engineer for a plastics manufacturing...Ch. 11 - When a wine generator is installed there is a...
Additional Engineering Textbook Solutions
Find more solutions based on key concepts
Locate the centroid of the area. Prob. 9-17
INTERNATIONAL EDITION---Engineering Mechanics: Statics, 14th edition (SI unit)
Repeat Problem 4-6 except solve by the vector loop method.
DESIGN OF MACHINERY
What types of polymers are most commonly blow molded?
DeGarmo's Materials and Processes in Manufacturing
The spring of k and unstretched length 1.5R is attached to the disk at a radial distance of 0.75R from the cent...
Engineering Mechanics: Statics
How is the hydrodynamic entry length defined for flow in a pipe? Is the entry length longer in laminar or turbu...
Fluid Mechanics Fundamentals And Applications
Steady state conduction rate to the warm compressor to the net power produces theoretically by thermodynamic ba...
Introduction to Heat Transfer
Knowledge Booster


Learn more about
Need a deep-dive on the concept behind this application? Look no further. Learn more about this topic, mechanical-engineering and related others by exploring similar questions and additional content below.Similar questions
- What indices do we use to evaluate the control quality? Please write as many as possible and mark all of them on your sample drawing. Please make a clean drawing.arrow_forwardTest tube level indicator length is the quality characteristic of interest. 28 samples with sample size of 4 each, are chosen from the process. The data yields an average length of 11 cm and process standard deviation of 4 cm. What is the probability of having the length between 9 and 12 cm?arrow_forwardPlease answer the question clearly, stating how you chose the formulas and what each variable represents. Thank you!arrow_forward
- Suppose you have conducted 25 measurements of a random variable (Temperature) and obtained the following data in Table 2 below: Calculate the sample mean temperature, standard deviation, and standard deviation of the means of these temperature measurements. Estimate 95% confidence interval for true mean temperature. Determine the range within which the true mean temperature exists at a 95% confidence level based on this finite datasetarrow_forwardMeasurements of 10 min each give gross and background count rates, respectively, of 72 and 54 cpm, for a net count rate of 18 cpm. What are the standard deviations of the following count rates: A. gross? B. background? C. net?arrow_forwardQuality Engineering question Pleas, explain briefly the necessity and benefit of collecting data and using statistical methods in production processes. Pleas, list the types of data collected and analyses implemented (graphics followed) with their reason. Please answer in your own words. Thank you.arrow_forward
- Bottles for room spray are supposed to weigh exactly 16 oz. Inspectors want to develop process control charts. They take o7 boxes of five bottles each and weigh them. They obtain the following data. The mean weights of each of the 07 samples are 14.6,16.5,18.1,13.2,16,15.9, and 14.8 respectively. Likewise, the range values for the each of 07 samples are o.7,0.5, 0.4,0.2,0.4,0.5, and o.9 respectively. Ebr the X-bar charts and R-charts, the Parameters, A2, D3 and D4 are respectively.arrow_forwardThe sales of a product during the last four years were 860, 880, 870 and 890 units. The forecast for the fourth year was 876 units. If the forecast for the fifth year, using simple exponential smoothing, is equal to the forecast using a three period moving average, what is the value of the exponential smoothing constant?arrow_forwardDiscuss the effects of five different production errors on the overall performance of manufacturing of engine cylinders for automotive industry. Your answer must be supported with data sourced via either literature searchesarrow_forward
- A company uses exponential smoothing with trend toforecast monthly sales of its product, which show a trend pattern.At the end of week 5, the company wants to forecast sales for week6. Th e trend through week 4 has been 20 additional cases sold perweek. Average sales have been 85 cases per week. The demand forweek 5 was 90 cases. Th e company uses α = 0.20 and β = 0.10.Make a forecast including trend for week 6arrow_forwardIn NFPA diamond, red indicates the fire hazardEntropy is path functionAccording to hazard and risk assessment, if the occurrence is frequent and catastrophic, then it is unacceptableFor constant volume process, work is zeroA.) If all 4 statements are trueB.) If 3 of the 4 statements are trueC.) If 2 of the 4 statements are trueD.) If only 1 of the 4 statements is trueE.) If none of the 4 statements is truearrow_forwardTen replicate analysis of the concentration of mercury in a sample of commercial gas condensed to give the following results 23.3 , 22.5 , 21.9 , 21.5, 19.9 , 21.3 , 21.7 , 23.8 , 22.6 , 24.7 Calculate the mean, standard deviation, RSD and 99% confidence limitarrow_forward
arrow_back_ios
SEE MORE QUESTIONS
arrow_forward_ios
Recommended textbooks for you
 Elements Of ElectromagneticsMechanical EngineeringISBN:9780190698614Author:Sadiku, Matthew N. O.Publisher:Oxford University Press
 Mechanics of Materials (10th Edition)Mechanical EngineeringISBN:9780134319650Author:Russell C. HibbelerPublisher:PEARSON
 Thermodynamics: An Engineering ApproachMechanical EngineeringISBN:9781259822674Author:Yunus A. Cengel Dr., Michael A. BolesPublisher:McGraw-Hill Education
 Control Systems EngineeringMechanical EngineeringISBN:9781118170519Author:Norman S. NisePublisher:WILEY
 Mechanics of Materials (MindTap Course List)Mechanical EngineeringISBN:9781337093347Author:Barry J. Goodno, James M. GerePublisher:Cengage Learning
 Engineering Mechanics: StaticsMechanical EngineeringISBN:9781118807330Author:James L. Meriam, L. G. Kraige, J. N. BoltonPublisher:WILEY
Elements Of Electromagnetics
Mechanical Engineering
ISBN:9780190698614
Author:Sadiku, Matthew N. O.
Publisher:Oxford University Press
Mechanics of Materials (10th Edition)
Mechanical Engineering
ISBN:9780134319650
Author:Russell C. Hibbeler
Publisher:PEARSON
Thermodynamics: An Engineering Approach
Mechanical Engineering
ISBN:9781259822674
Author:Yunus A. Cengel Dr., Michael A. Boles
Publisher:McGraw-Hill Education
Control Systems Engineering
Mechanical Engineering
ISBN:9781118170519
Author:Norman S. Nise
Publisher:WILEY
Mechanics of Materials (MindTap Course List)
Mechanical Engineering
ISBN:9781337093347
Author:Barry J. Goodno, James M. Gere
Publisher:Cengage Learning
Engineering Mechanics: Statics
Mechanical Engineering
ISBN:9781118807330
Author:James L. Meriam, L. G. Kraige, J. N. Bolton
Publisher:WILEY
Chemical and Phase Equilibrium; Author: LearnChemE;https://www.youtube.com/watch?v=SWhZkU7e8yw;License: Standard Youtube License