
Videos
Instructions for Exercises 11.5 through 11.8: Use Excel’s Data Analysis (or other software) to perform the one-factor ANOVA using α = .05. For each exercise: (a) State the hypotheses. (b) What are the degrees of freedom for the test? (c) What is the critical value of F at the 5 percent level of significance? (d) State your conclusion about the population means. (e) Interpret the p-value. Optional: (f*) Make a plot of the data for each group (e.g., using MegaStat), or confidence intervals for the group means (e.g., using Minitab). What do the plots show?
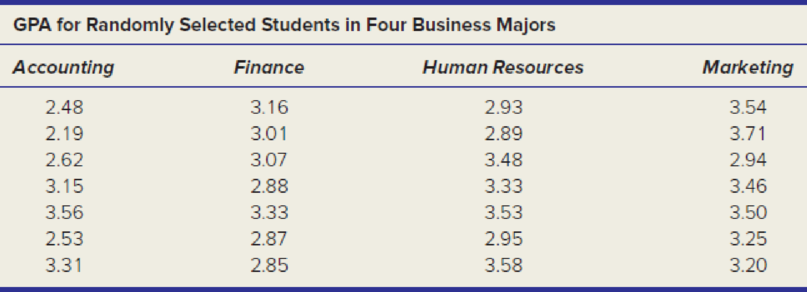
11.7 Semester GPAs are compared for seven randomly chosen students in each class level at Oxnard University. Do the data show a significant difference in
Want to see the full answer?
Check out a sample textbook solution
Chapter 11 Solutions
Gen Combo Ll Applied Statistics In Business & Economics; Connect Access Card


 Glencoe Algebra 1, Student Edition, 9780079039897...AlgebraISBN:9780079039897Author:CarterPublisher:McGraw Hill
 Calculus For The Life SciencesCalculusISBN:9780321964038Author:GREENWELL, Raymond N., RITCHEY, Nathan P., Lial, Margaret L.Publisher:Pearson Addison Wesley,