
Videos
Instructions: For each data set: (a) State the hypotheses. (b) Use Excel’s Data Analysis (or other software) to perform the two-factor ANOVA with replication, using a = .05. (c) State your conclusions about the main effects and interaction effects. (d) Interpret the p-values carefully. Ambitious students: (e*) Create interaction plots and interpret them.
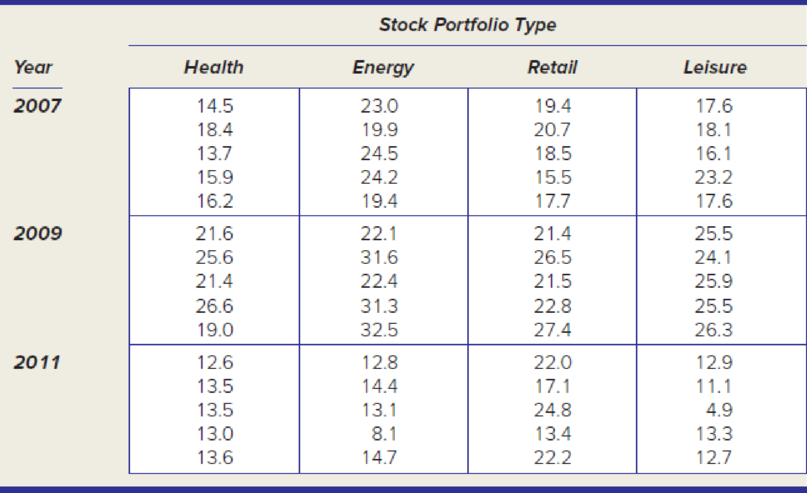
A small independent stock broker has created four sector portfolios for her clients. Each portfolio always has five stocks that may change from year to year. The volatility (coefficient of variation) of each stock is recorded for each year. Are the main effects significant? Is there an interaction?
Want to see the full answer?
Check out a sample textbook solution
Chapter 11 Solutions
Gen Combo Ll Applied Statistics In Business & Economics; Connect Access Card
Additional Math Textbook Solutions
Elementary Statistics (Text Only)
Statistical Reasoning for Everyday Life (5th Edition)
An Introduction to Mathematical Statistics and Its Applications (6th Edition)
Statistics for Business & Economics, Revised (MindTap Course List)
Stats: Modeling the World Nasta Edition Grades 9-12
Elementary Statistics: A Step By Step Approach


- What is an experiment?arrow_forwardWaveney DIY Centers (WDC) operates a few dozen stores in the eastern United States. The stores are popular with home remodelers, contractors, and do-it-yourself customers. The managers at Waveney are interested in understanding what drives costs as well as getting better cost estimates when planning new stores. The area manager for the Southeast Region is interested in new data analysis approaches to management and offered to run a test using data from the 14 stores in the region. The Initial thoughts of the managers and the financial analysts in the region were that two primary factors drove store costs: store area (square footage) and revenue. The following data were collected from the most recent year of operations (revenues and costs in thousands of dollars). Store SE-01 SE-02 SE-03 SE-04 SE-05 SE-06 SE-07 SE-08 SE-09 SE-10 SE-11 SE-12 SE-13 SE-14 Revenues (5000) $ 21,245 16,182 Store cost 26,421 20,089 20,366 18,456 25,205 13,401 23,781 16,530 21,058 17,820 14,374 23,604 Area…arrow_forwardLynn University wants to examine whether students display better academic performance in class versus online. They have collected GPAs of two different samples of students, a sample from classes that take place in-person and a sample from classes that take place online. The data set is below. They predict that in-class students perform better than online students. Academic Performance In Class GPA Online GPA 4.0 4.0 3.5 2.2 3.7 3.3 3.5 3.7 2.0 2.5 3.2 3.8 3.3 3.8 What is the t-statistic from this t-test? (Round to 2 decimals)arrow_forward
- Lynn University wants to examine whether students display better academic performance in class versus online. They have collected GPAs of two different samples of students, a sample from classes that take place in-person and a sample from classes that take place online. The data set is below. They predict that in-class students perform better than online students. GPA's In Class GPA Online GPA 4.0 4.0 3.5 2.2 3.7 3.3 3.5 3.7 2.0 2.5 3.2 3.8 3.3 3.8 What type of t-test should we use for this research question? Group of answer choices a) One sample b) Independent samples c) Paired Samplesarrow_forwardLynn University wants to examine whether students display better academic performance in class versus online. They have collected GPAs of two different samples of students, a sample from classes that take place in-person and a sample from classes that take place online. The data set is below. They predict that in-class students perform better than online students. Performance In Class GPA Online GPA 4.0 4.0 3.5 2.2 3.7 3.3 3.5 3.7 2.0 2.5 3.2 3.8 3.3 3.8 For this test, we should use ________ critical and p values. Group of answer choices a) One tail b) Two tail c) Three tail d) None of the answersarrow_forwardA phamaceutical company wants to test the effectiveness of a new allergy drug. The company identifies 250 females 30-35 years old who suffer from severe allergies. The subjects are randomly assigned into two groups. One group is given the new allergy drug and the other is given a placebo that looks exactly like the new allergy drug. After six months, the subjects' symptoms are studied and compared. Answer parts (a) through (c) below. O B. The experimental units are the symptoms from the drug. The treatment is the new allergy drug. O C. The experimental unit is the new allergy drug. The treatments are the severe allergies the patients suffer from. O D. The experimental units are the 30- to 35-year-old females being given the treatment. The treatment is the new allergy drug. (b) Identify a potential problem with the experiment design being used and suggest a way to improve it. Choose the correct answer below. O A. There may be a bias on the part of the patients since they do not know if…arrow_forward
- Does the example represent an observational study or an experiment? Car accident data is obtained from the Ohio database. It is found that more accidents happened at night.arrow_forwardPursuing an MBA is a major personal investment. Tuition and expenses associated with business school programs are costly, but the high costs come with hopes of career advancement and high salaries. A prospective MBA student would like to examine the factors that impact starting salary upon graduation and decides to develop a model that uses program per-year tuition as a predictor of starting salary. Data were collected for 37 full-time MBA programs offered at private universities. The data are stored in the accompanying table Use the least-squares method to determine the regression coefficients b0 and b1.arrow_forwardA healthcare provider monitors the number of CAT scans performed each month in each of its clinics. The most recent year of data for a particular clinic follows (the reported variable is the number of CAT scans each month expressed as the number of CAT scans per thousand members of the health plan): 2.31, 2.09, 2.36, 1.95, 1.98, 2.25, 2.16, 2.07, 1.88, 1.94, 1.97, 2.02.(a) Find a 95% two-sided CI on the mean number of CAT scans performed each month at this clinic.(b) Historically, the mean number of scans performed by all clinics in the system has been 1.95. If there any evidence that this particular clinic performs more CAT scans on average than the overall system average?arrow_forward
- Find part Barrow_forwardBack in April and May of 1985, the Gallup organization conducted a poll to estimate the percentage of Americans who approved of how President Reagan was handling his job. At the 5% significance level, do the data suggest that the percentage of those who approved of Reagan increased from April to May in 1985? Population 1: April p = 795/1528 = 0.5203Population 2: May p = 840/1528 = 0.5497Show all your steps, setting up your null and alternative hypothesis.arrow_forwardResearch Scenario: A substance abuse counselor wants to demonstrate the effect of situational stress on alcohol cravings. He recruits two groups of men who are similar in respect to the history of alcohol use and demographic variables. He divides these participants into two groups. In one group (n=11), the men are exposed to a stressful situation and then asked to complete a measure rating their alcohol cravings on a scale from 0-10, where 0 represents no cravings and 10 represents intense cravings. In the second group (n = 10), the men are exposed to a neutral situation and asked to complete the same measure. The data are contained in the table below. Does a stressful situation result in more intense alcohol cravings than a non-stressful situation?Stressful Situation Neutral Situation Stressful Situation Neutral Situation 5 3 7 8 7 2 4 3 8 1 6 6 3 2 9 8 6 9 6 3 8arrow_forward
 Glencoe Algebra 1, Student Edition, 9780079039897...AlgebraISBN:9780079039897Author:CarterPublisher:McGraw Hill
 Big Ideas Math A Bridge To Success Algebra 1: Stu...AlgebraISBN:9781680331141Author:HOUGHTON MIFFLIN HARCOURTPublisher:Houghton Mifflin Harcourt
 Holt Mcdougal Larson Pre-algebra: Student Edition...AlgebraISBN:9780547587776Author:HOLT MCDOUGALPublisher:HOLT MCDOUGAL
 College Algebra (MindTap Course List)AlgebraISBN:9781305652231Author:R. David Gustafson, Jeff HughesPublisher:Cengage Learning