
Mathematical Statistics with Applications
7th Edition
ISBN: 9781111798789
Author: Dennis O. Wackerly
Publisher: Cengage Learning
expand_more
expand_more
format_list_bulleted
Videos
Textbook Question
Chapter 11.3, Problem 12E
Processors usually preserve cucumbers by fermenting them in a low-salt brine (6% to 9% sodium chloride) and then storing them in a high-salt brine until they are used by processors to produce various types of pickles. The high-salt brine is needed to retard softening of the pickles and to prevent freezing when they are stored outside in northern climates. Data showing the reduction in firmness of pickles stored over time in a low-salt brine (2% to 3%) are given in the accompanying table.
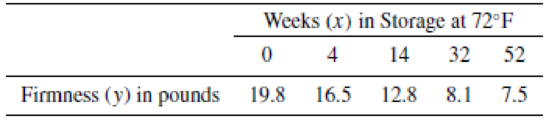
- a Fit a least-squares line to the data.
- b As a check on your calculations, plot the five data points and graph the line. Does the line appear to provide a good fit to the data points?
- c Use the least-squares line to estimate the
mean firmness of pickles stored for 20 weeks.
Expert Solution & Answer
Want to see the full answer?
Check out a sample textbook solution
Students have asked these similar questions
A study was conducted to assess the impact of nutrient enrichment on zooplankton densities in A & B Islands. An ecologist sampled populations of zooplankton in these two locations and observed the nutrient enrichment level was higher in A island when compared with the level in B island. It is predicted the zooplankton densities in A island will be greater than those found in B island.
A strain of genetically engineered cotton, known as Bt cotton, is resistant to certain insects, which results in larger yields of cotton. Farmers in northern China have increased the number of acres planted in Bt cotton. Because Bt cotton is resistant to certain pests, farmers have also reduced their use of insecticide. Scientists in China were interested in the long‑term effects of Bt cotton cultivation and decreased insecticide use on insect populations that are not affected by Bt cotton. One such insect is the mirid bug. Scientists measured the number of mirid bugs per 100 plants and the proportion of Bt cotton planted at 38 locations in northern China for the 12‑year period from 1997–2008. The scientists reported this regression analysis:
number of mirid bugs per 100 plants=0.54+6.81× Bt cotton planting proportion
?2=0.90, ?<0.0001
What does the slope b=6.81 say about the relation between Bt cotton planting proportion and number of mirid bugs per 100 plants?
- Scientists…
One effect of the pesticide DDT upon birds is to inhibit the production of the enzyme carbonic anhydrase, which controls calcium metabolism. It is believed that this causes eggshells to be thinner and weaker than normal and makes the eggs more prone to breakage. An experiment was conducted where 16 sparrow hawks were fed a mixture of 3 ppm dieldrin and 15 ppm DDT (a combination often found in contaminated prey). The first egg laid by each bird was measured, and the mean shell thickness was found to be 0.19 mm. A “normal” eggshell has a mean thickness of 0.2 mm.
What are the null and alternative hypotheses?
Chapter 11 Solutions
Mathematical Statistics with Applications
Ch. 11.3 - If 0 and 1 are the least-squares estimates for the...Ch. 11.3 - Prob. 2ECh. 11.3 - Fit a straight line to the five data points in the...Ch. 11.3 - Auditors are often required to compare the audited...Ch. 11.3 - Prob. 5ECh. 11.3 - Applet Exercise Refer to Exercises 11.2 and 11.5....Ch. 11.3 - Prob. 7ECh. 11.3 - Laboratory experiments designed to measure LC50...Ch. 11.3 - Prob. 9ECh. 11.3 - Suppose that we have postulated the model...
Ch. 11.3 - Some data obtained by C.E. Marcellari on the...Ch. 11.3 - Processors usually preserve cucumbers by...Ch. 11.3 - J. H. Matis and T. E. Wehrly report the following...Ch. 11.4 - a Derive the following identity:...Ch. 11.4 - An experiment was conducted to observe the effect...Ch. 11.4 - Prob. 17ECh. 11.4 - Prob. 18ECh. 11.4 - A study was conducted to determine the effects of...Ch. 11.4 - Suppose that Y1, Y2,,Yn are independent normal...Ch. 11.4 - Under the assumptions of Exercise 11.20, find...Ch. 11.4 - Prob. 22ECh. 11.5 - Use the properties of the least-squares estimators...Ch. 11.5 - Do the data in Exercise 11.19 present sufficient...Ch. 11.5 - Use the properties of the least-squares estimators...Ch. 11.5 - Let Y1, Y2, . . . , Yn be as given in Exercise...Ch. 11.5 - Prob. 30ECh. 11.5 - Using a chemical procedure called differential...Ch. 11.5 - Prob. 32ECh. 11.5 - Prob. 33ECh. 11.5 - Prob. 34ECh. 11.6 - For the simple linear regression model Y = 0 + 1x...Ch. 11.6 - Prob. 36ECh. 11.6 - Using the model fit to the data of Exercise 11.8,...Ch. 11.6 - Refer to Exercise 11.3. Find a 90% confidence...Ch. 11.6 - Refer to Exercise 11.16. Find a 95% confidence...Ch. 11.6 - Refer to Exercise 11.14. Find a 90% confidence...Ch. 11.6 - Prob. 41ECh. 11.7 - Suppose that the model Y=0+1+ is fit to the n data...Ch. 11.7 - Prob. 43ECh. 11.7 - Prob. 44ECh. 11.7 - Prob. 45ECh. 11.7 - Refer to Exercise 11.16. Find a 95% prediction...Ch. 11.7 - Refer to Exercise 11.14. Find a 95% prediction...Ch. 11.8 - The accompanying table gives the peak power load...Ch. 11.8 - Prob. 49ECh. 11.8 - Prob. 50ECh. 11.8 - Prob. 51ECh. 11.8 - Prob. 52ECh. 11.8 - Prob. 54ECh. 11.8 - Prob. 55ECh. 11.8 - Prob. 57ECh. 11.8 - Prob. 58ECh. 11.8 - Prob. 59ECh. 11.8 - Prob. 60ECh. 11.9 - Refer to Example 11.10. Find a 90% prediction...Ch. 11.9 - Prob. 62ECh. 11.9 - Prob. 63ECh. 11.9 - Prob. 64ECh. 11.9 - Prob. 65ECh. 11.10 - Refer to Exercise 11.3. Fit the model suggested...Ch. 11.10 - Prob. 67ECh. 11.10 - Fit the quadratic model Y=0+1x+2x2+ to the data...Ch. 11.10 - The manufacturer of Lexus automobiles has steadily...Ch. 11.10 - a Calculate SSE and S2 for Exercise 11.4. Use the...Ch. 11.12 - Consider the general linear model...Ch. 11.12 - Prob. 72ECh. 11.12 - Prob. 73ECh. 11.12 - An experiment was conducted to investigate the...Ch. 11.12 - Prob. 75ECh. 11.12 - The results that follow were obtained from an...Ch. 11.13 - Prob. 77ECh. 11.13 - Prob. 78ECh. 11.13 - Prob. 79ECh. 11.14 - Prob. 80ECh. 11.14 - Prob. 81ECh. 11.14 - Prob. 82ECh. 11.14 - Prob. 83ECh. 11.14 - Prob. 84ECh. 11.14 - Prob. 85ECh. 11.14 - Prob. 86ECh. 11.14 - Prob. 87ECh. 11.14 - Prob. 88ECh. 11.14 - Refer to the three models given in Exercise 11.88....Ch. 11.14 - Prob. 90ECh. 11.14 - Prob. 91ECh. 11.14 - Prob. 92ECh. 11.14 - Prob. 93ECh. 11.14 - Prob. 94ECh. 11 - At temperatures approaching absolute zero (273C),...Ch. 11 - A study was conducted to determine whether a...Ch. 11 - Prob. 97SECh. 11 - Prob. 98SECh. 11 - Prob. 99SECh. 11 - Prob. 100SECh. 11 - Prob. 102SECh. 11 - Prob. 103SECh. 11 - An experiment was conducted to determine the...Ch. 11 - Prob. 105SECh. 11 - Prob. 106SECh. 11 - Prob. 107SE
Knowledge Booster


Learn more about
Need a deep-dive on the concept behind this application? Look no further. Learn more about this topic, statistics and related others by exploring similar questions and additional content below.Similar questions
- Assume we have data demonstrating a strong linear link between the amount of fertilizer applied to certain plants and their yield. Which is the independent variable in this research question?arrow_forwardA deficiency of the trace element selenium in the diet can negatively impact growth, immunity, muscle and neuromuscular function, and fertility. The introduction of selenium supplements to dairy cows is justified when pastures have low selenium levels. Authors of the article “Effects of Short-Term Supplementation with Selenised Yeast on Milk Production and Composition of Lactating Cows” (Australian J. of Dairy Tech., 2004: 199–203) supplied the following data on milk selenium concentration (mg/L) for a sample of cows given a selenium supplement and a control sample given no supplement, both initially and after a 9-day period. Obs Init Se Init Cont Final Se Final Cont 1 11.4 9.1 138.3 9.3 2 9.6 8.7 104 8.8 3 10.1 9.7 96.4 8.8 4 8.5 10.8 89 10.1 5 10.3 10.9 88 9.6 6 10.6 10.6 103.8 8.6 7 11.8 10.1 147.3 10.4 8 9.8 12.3 97.1 12.4 9 10.9 8.8 172.6 9.3 10 10.3…arrow_forwardResearchers examined the effect of phosphate supplementation on bone formation in 6 healthy adult dogs. For each dog, bone formation was measured twice: once after 12 weeks of phosphate supplementation, and once after a 12-week control period. The results in percent bone growth per year are shown below. Do these data provide evidence that phosphatesupplementation significantly stimulates bone formation?Dog ID 1 2 3 4 5 6Control 1.73 3.37 3.59 2.05 1.86 3.60Phosphate 8.16 4.58 3.98 5.24 3.04 7.03 c. Based on the P-value, what conclusion can be drawn at a 5% significance level?arrow_forward
- Researchers examined the effect of phosphate supplementation on bone formation in 6 healthy adult dogs. For each dog, bone formation was measured twice: once after 12 weeks of phosphate supplementation, and once after a 12-week control period. The results in percent bone growth per year are shown below. Do these data provide evidence that phosphatesupplementation significantly stimulates bone formation?Dog ID 1 2 3 4 5 6Control 1.73 3.37 3.59 2.05 1.86 3.60Phosphate 8.16 4.58 3.98 5.24 3.04 7.03 Based on the P-value, what conclusion can be drawn at a 5% significance level?arrow_forwardIt is hypothesized that there are fluctuations in norepinephrine (NE) levels which accompany fluctuations in affect with bipolar affective disorder (manic-depressive illness). Thus, during depressive states, NE levels drop; during manic states, NE levels increase. To test this relationship, researchers measured the level of NE by measuring the metabolite 3-methoxy-4-hydroxyphenylglycol (MHPG in micro gram per 24 hour) in the patient's urine experiencing varying levels of mania/depression. Increased levels of MHPG are correlated with increased metabolism (thus higher levels) of central nervous system NE. Levels of mania/depression were also recorded on a scale with a low score indicating increased mania and a high score increased depression. The data is provided below. MHPG Affect 980 22 1209 26 1403 8 1950 10 1814 5 1280 19 1073 26 1066 12 880 23 776 28 a. Can MHPG significantly predict…arrow_forwardAt the 5% level of significance, which variables are statistically significant? If the price of cement per yard increases by 10, what will happen to the estimated quantity of cement demanded? What happens if it will increase by 20%?arrow_forward
- Here is a dataset containing plant growth measurements of plants grown in solutions of commonly-found chemicals in roadway runoff.Phragmites australis, a fast-growing non-native grass common to roadsides and disturbed wetlands of Tidewater Virginia, was grown in a greenhouse and watered with either: Distilled water (control); A weak petroleum solution (representing standard roadway runoff); Sodium chloride solution; Magnesium chloride solution; De-icing brine (50% sodium chloride and 50% magnesium chloride).Twenty grass preparations were used for each solution, and total growth (in cm) was recorded after watering every other day for 40 days.-Perform the correct statistical test to determine the p-value.-Report your answer rounded to four decimal places.-You should use formulas, functions, and the Data Analysis ToolPak in MS Excel to avoid additive rounding errors. Here are some useful functions: =t.test(array1,array2,tails,type) Produces a p-value for any…arrow_forwardWhen wildebeest are more abundant, they graze the grass more heavily, so there are fewer fires and moretrees grow. Lions feed more successfully when there are more trees, so the lion population increases. Thedata on one part of this cycle, wildebeest abundance (in thousands of animals) and the percent of the grassarea that burned in the same year are on the spreadsheet. To what extent do these data support the claim that more wildebeest reduce the percent of grasslands that burn? How rapidly does burned area decrease as the number of wildebeest increases? To answer these questions, create a scatterplot and add the regression line. Describe the scatterplot. Interpret the slope and intercept in context of the problem. Does the intercept explanation make sense in the real world? Find the correlation coefficient and coefficient of determination. What do they tell us about the relationship between number of wildebeest and percent of grassland burned? Beest (in 1000s) Percent Burned…arrow_forwardThe owner of a moving company typically has his most experienced manager predict the total number of labor hours that will be required to complete an upcoming move. This approach has proved useful in the past, but the owner has the business objective of developing a more accurate method of predicting labor hours. In a preliminary effort to provide a more accurate method, the owner has decided to use the number of cubic feet moved as the independent variable and has collected data for 36 moves in which the origin and destination were within the borough of Manhattan in New York City and in which the travel time was an insignificant portion of the hours worked. If the sum of squares Y is 1,513.32 and the sum of squares error is 176.22. What proportion of variation in labor hours is explained by the number of cubic feet moved? Hint: Provide answer accurate to 4 decimal places.arrow_forward
- The owner of a moving company typically has his most experienced manager predict the total number of labor hours that will be required to complete an upcoming move. This approach has proved useful in the past, but the owner has the business objective of developing a more accurate method of predicting labor hours. In a preliminary effort to provide a more accurate method, the owner has decided to use the number of cubic feet moved as the independent variable and has collected data for 36 moves in which the origin and destination were within the borough of Manhattan in New York City and in which the travel time was an insignificant portionof the hours worked. The intercept for the sample regression line that the owner has computed is -2.24 and the slope is 0.03. What is the predicted number of labor hours for moving 484 cubic feet? Hint: Provide your answer accurate to 2 decimal places.arrow_forwarda )Do these data provide good evidence that increasing the temperature causes the yield to increase, within the range of the data? Or might the result be due to confounding? Explain.arrow_forwardIn an observational study, it was noticed that people that eat more chocolate tend to have better blood flow than the general population. Researchers wonder whether the improved blood flow might be caused by flavanols (a molecule found in many foods). Dark chocolate contains a high concentration of flavanols, but milk chocolate contains a much lower concentration. How could the researchers design an experiment to determine the effects of flavanol on blood flow from the different types of chocolate?arrow_forward
arrow_back_ios
arrow_forward_ios
Recommended textbooks for you
 Linear Algebra: A Modern IntroductionAlgebraISBN:9781285463247Author:David PoolePublisher:Cengage Learning
 Glencoe Algebra 1, Student Edition, 9780079039897...AlgebraISBN:9780079039897Author:CarterPublisher:McGraw Hill
Linear Algebra: A Modern Introduction
Algebra
ISBN:9781285463247
Author:David Poole
Publisher:Cengage Learning
Glencoe Algebra 1, Student Edition, 9780079039897...
Algebra
ISBN:9780079039897
Author:Carter
Publisher:McGraw Hill
Hypothesis Testing using Confidence Interval Approach; Author: BUM2413 Applied Statistics UMP;https://www.youtube.com/watch?v=Hq1l3e9pLyY;License: Standard YouTube License, CC-BY
Hypothesis Testing - Difference of Two Means - Student's -Distribution & Normal Distribution; Author: The Organic Chemistry Tutor;https://www.youtube.com/watch?v=UcZwyzwWU7o;License: Standard Youtube License