
Essentials of Statistics (6th Edition)
6th Edition
ISBN: 9780134685779
Author: Mario F. Triola
Publisher: PEARSON
expand_more
expand_more
format_list_bulleted
Videos
Textbook Question
Chapter 11.3, Problem 17BB
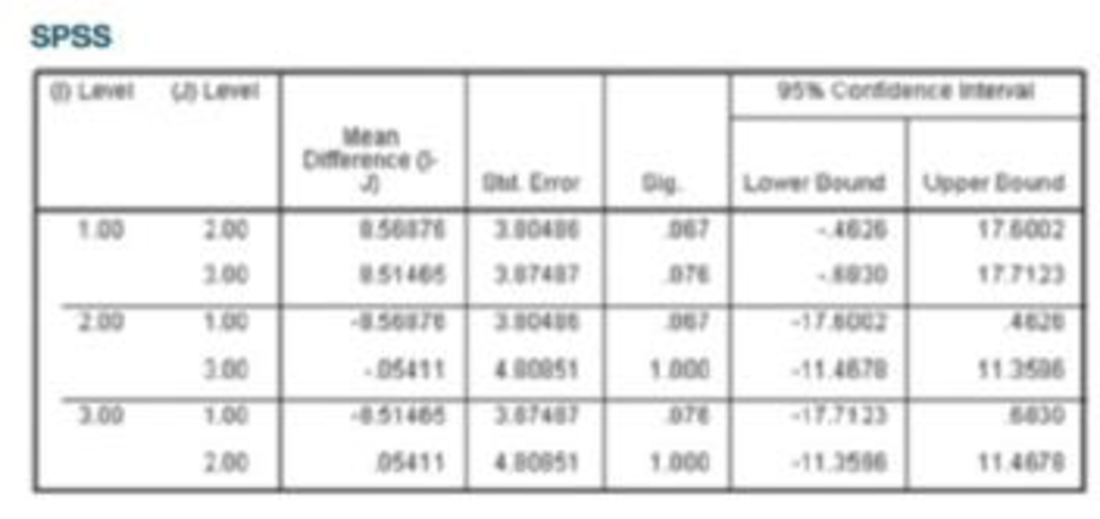
Tukey Test A display of the Bonferroni test results from Table 12-1 (which is part of the Chapter Problem) is provided on page 577. Shown on the top of the next page is the SPSS-generated display of results from the Tukey test using the same data. Compare the Tukey test results to those from the Bonferroni test.
Expert Solution & Answer
Want to see the full answer?
Check out a sample textbook solution
Students have asked these similar questions
Tukey Test A display of the Bonferroni test results from Table 12-1 (which is part of the Chapter Problem) is provided on page 577. Shown on the top of the next page is the SPSS-generated display of results from the Tukey test using the same data. Compare the Tukey test results to those from the Bonferroni test.
SPSS
A smoke alarm is supposed to make noise when there is a fire and stay silent when there is no fire. Designers of a smoke detector would use the following hypotheses:
H0: There is no fire.
HA: There is a fire.
If you were designing a smoke detector, would you want to pick a large alpha or small alpha?
Group of answer choices
A Type I error is worse than a Type II error, so I would pick a large alpha.
A Type I error is worse than a Type II error, so I would pick a small alpha.
A Type II error is worse than a Type I error, so I would pick a large alpha.
A Type II error is worse than a Type I error, so I would pick a small alpha.
A veterinary study of horses looked at water sources for horses, and the investigators found that horses received water from a well, from city water, or from a stream. The investigators wanted to know if horses are equally likely to get water from each of those three sources. They collected data and observed the given values.
Water Source
Well
City Water
Stream
Total
Observed count
62
43
31
136
The appropriate chi‑square goodness‑of‑fit hypothesis is:
Chapter 11 Solutions
Essentials of Statistics (6th Edition)
Ch. 11.1 - Cybersecurity The table below lists leading digits...Ch. 11.1 - 2. Cybersecurity When using the data from Exercise...Ch. 11.1 - Cybersecurity The accompanying Statdisk results...Ch. 11.1 - Cybersecurity What do the results from the...Ch. 11.1 - In Exercises 520, conduct the hypothesis test and...Ch. 11.1 - In Exercises 520, conduct the hypothesis test and...Ch. 11.1 - In Exercises 520, conduct the hypothesis test and...Ch. 11.1 - In Exercises 520, conduct the hypothesis test and...Ch. 11.1 - In Exercises 520, conduct the hypothesis test and...Ch. 11.1 - In Exercises 520, conduct the hypothesis test and...
Ch. 11.1 - In Exercises 520, conduct the hypothesis test and...Ch. 11.1 - In Exercises 520, conduct the hypothesis test and...Ch. 11.1 - In Exercises 520, conduct the hypothesis test and...Ch. 11.1 - In Exercises 520, conduct the hypothesis test and...Ch. 11.1 - In Exercises 520, conduct the hypothesis test and...Ch. 11.1 - In Exercises 520, conduct the hypothesis test and...Ch. 11.1 - Ben fords Law. According to Benfords law, a...Ch. 11.1 - Ben fords Law. According to Benfords law, a...Ch. 11.1 - Ben fords Law. According to Benfords law, a...Ch. 11.1 - Ben fords Law. According to Benfords law, a...Ch. 11.1 - Assumed mid-point x=fxn=39825180=221.25...Ch. 11.2 - Handedness and Cell Phone Use The accompanying...Ch. 11.2 - Ear Preference for Cell Phone Use 2. Hypotheses...Ch. 11.2 - Hypothesis Test The accompanying TI-83/84 Plus...Ch. 11.2 - Right-Tailed, Left-Tailed, Two-Tailed Is the...Ch. 11.2 - Prob. 5BSCCh. 11.2 - In Exercises 5-18, test the given claim. 6. Splint...Ch. 11.2 - In Exercises 5-18, test the given claim. 7....Ch. 11.2 - Prob. 8BSCCh. 11.2 - In Exercises 5-18, test the given claim. 9. Four...Ch. 11.2 - In Exercises 5-18, test the given claim. 10....Ch. 11.2 - In Exercises 5-18, test the given claim. 11....Ch. 11.2 - In Exercises 5-18, test the given claim. 12. Nurse...Ch. 11.2 - Soccer Strategy In soccer, serious fouls in the...Ch. 11.2 - In Exercises 5-18, lest the given claim. 14. Is...Ch. 11.2 - In Exercises 518, test the given claim. 15....Ch. 11.2 - In Exercises 5-18, test the given claim. 16....Ch. 11.2 - Prob. 17BSCCh. 11.2 - In Exercises 5-18, test the given claim. 18....Ch. 11.2 - In Exercises 5-18, lest the given claim. 19. Car...Ch. 11.2 - Is the Home Field Advantage Independent of the...Ch. 11.2 - Equivalent Tests A X2 test involving a 2 2 table...Ch. 11.2 - Using Yatess Correction for Continuity The...Ch. 11.3 - In Exercises 1-4, use the following listed arrival...Ch. 11.3 - In Exercises 1-4, use the following listed arrival...Ch. 11.3 - In Exercises 1-4, use the following listed arrival...Ch. 11.3 - In Exercises 1-4, use the following listed arrival...Ch. 11.3 - In Exercises 5-16, use analysis of variance for...Ch. 11.3 - In Exercises 5-16, use analysis of variance for...Ch. 11.3 - In Exercises 5-16, use analysis of variance for...Ch. 11.3 - In Exercises 5-16, use analysis of variance for...Ch. 11.3 - In Exercises 5-16, use analysis of variance for...Ch. 11.3 - Prob. 10BSCCh. 11.3 - Triathlon Times Jeff Parent is a statistics...Ch. 11.3 - Arsenic in Rice Listed below are amounts of...Ch. 11.3 - Prob. 13BSCCh. 11.3 - Speed Dating Listed below are attribute ratings of...Ch. 11.3 - Tukey Test A display of the Bonferroni test...Ch. 11.3 - Two-Way ANOVA The pulse rates in Table 12-3 from...Ch. 11 - Exercises 1-5 refer to the sample data in the...Ch. 11 - Exercises 15 refer to the sample data in the...Ch. 11 - Exercises 15 refer to the sample data in the...Ch. 11 - Prob. 4CQQCh. 11 - Exercises 15 refer to the sample data in the...Ch. 11 - Questions 610 refer to the sample data in the...Ch. 11 - Questions 610 refer to the sample data in the...Ch. 11 - Questions 6-10 refer to the sample data in the...Ch. 11 - Questions 6-10 refer to the sample data in the...Ch. 11 - Motor Vehicle Fatalities The table below lists...Ch. 11 - Tooth Fillings The table below shows results from...Ch. 11 - American Idol Contestants on the TV show American...Ch. 11 - Clinical Trial of Lipitor Lipitor is the trade...Ch. 11 - Weather-Related Deaths For a recent year, the...Ch. 11 - Weather-Related Deaths Review Exercise 5 involved...Ch. 11 - Chocolate and Happiness In a survey sponsored by...Ch. 11 - Chocolate and Happiness Use the results from part...Ch. 11 - Chocolate and Happiness Use the results from part...Ch. 11 - One Big Bill or Many Smaller Bills In a study of...Ch. 11 - 6. Probability Refer to the results from the 150...Ch. 11 - Car Repair Costs Listed below are repair costs (in...Ch. 11 - Forward Grip Reach and Ergonomics When designing...Ch. 11 - Use Statdisk, Minitab, Excel, StatCrunch, a...Ch. 11 - FROM DATA TO DECISION Critical Thinking: Was...Ch. 11 - Cola Weights Data Set 26 Cola Weights and Volumes...Ch. 11 - Speed Dating Data Set 18 Speed Dating in Appendix...Ch. 11 - Author Readability Pages were randomly selected by...
Knowledge Booster


Learn more about
Need a deep-dive on the concept behind this application? Look no further. Learn more about this topic, statistics and related others by exploring similar questions and additional content below.Similar questions
- The null and alternative hypotheses for a hypothesis test of the difference in two population means are: Null Hypothesis:mu 1 equals mu 2 Alternative Hypothesis: mu 1 is less than mu 2 Notice that the alternative hypothesis is a one-tailed test. Suppose ttest_ind method from scipy module is used to perform the test and the output is (3.25, 0.0043). What is the P-value for this hypothesis test? Select one. Question 1 options: -3.25 0.00215 0.0043 3.25arrow_forwardenter the number of the expression indicating the null hypothesis and enter the number of the expression indicating the alternative hypothesis calculate a z and enter to the second decimal place enter the critical value for z (if using the .01 alpha leave) what do you make about the null? is this an effect or chance?arrow_forwardThe area head of GLOBE Broadband claims that more than 75 percent of his customers in Metro Manila are satisfied with the services they received. To test this claim, the local newspaper randomly surveyed 400 customers online and found out that 320 customers were satisfied and the remaining were unsatisfied. Test this claim at alpha value of 10% level of significance. The sample proportion is; 75% 80% 85% The population proportion is; 75% 80% 320% The claim of the area head can be expressed in terms of mathematical notation as; Ha : μ ≠ 75% Ha : μ < 75% Ha : μ > 75%arrow_forward
- The null and alternative hypotheses for a hypothesis test of the difference in two population means are: Null Hypothesis: μ1 = μ2 Alternative Hypothesis: μ1 < μ2 Notice that the alternative hypothesis is a one-tailed test. Suppose ttest_ind method from scipy module is used to perform the test and the output is (3.25, 0.0043). What is the P-value for this hypothesis test? Select one. -3.25 0.00215 0.0043 3.25arrow_forwardwe run a hypothesis test for the difference of two means mu1 and mu2, with an alternative hypothesis of mu1 < mu2. And suppose that the test statistic is t = -1.68 (and the t-model has 20 degrees of freedom). What is the p-value for this test?arrow_forwardQuestion 15: In a recent Super Bowl, a TV network predicted that 90 % of the audience would express an interest in seeing one of its forthcoming television shows. The network ran commercials for these shows during the Super Bowl. The day after the Super Bowl, and Advertising Group sampled 55 people who saw the commercials and found that 48 of them said they would watch one of the television shows.Suppose you are have the following null and alternative hypotheses for a test you are running:H0:p=0.9H0:p=0.9Ha:p>0.9Ha:p>0.9Calculate the test statistic, rounded to 3 decimal places z=arrow_forward
- Question 16 In this exercise, we are conducting many hypothesis tests to test a claim. Assume that the null hypothesis is true. If 120 tests are conducted using a significance level of 5%, approximately how many of the tests will incorrectly find significance?Enter your answer in accordance to the question statement of the tests will find significance.arrow_forwarda) Interpret the coefficient on pfmeals in Model 2 (mathematically and statistically). b) is the coefficient on pfmeals in Model 1 biased compared to the coefficient on pfmeals in Model 2. If so, by how much? c) What 2 conditions would need to be true for bias of pfmeals to exist? Use only the information from Models 1 and 2 above to answer this question.arrow_forwardA study is conducted examining possible differences between types of cancer for blue collar, white collar, and unemployed workers. Samples of 100 blue collar, 100 white collar, and 100 unemployed workers currently being treated for cancer are obtained. The types of cancer are classified as either Lunch, Stomach, or Other. Occupation lung stomach other Blue collar 53 17 30 White collar 10 67 23 Unemployed 30 30 40 A. State the appropriate null and alternate hypotheses for this problem. B. Calculate the test statistics. (By hand) C. Determine the rejection region. D. State the conclusion.arrow_forward
- A neuroscientist is interested in testing the effects of environment on dendritic branching in the hippocampus (dendrites increase the receptivity of neurons and may be an important basis of cognition). To test this, he took one group of rats (n = 11) and housed them in an “enriched” environment (consisting of a large box with tunnels to run through, toys to play with, etc.) and then he took another group of rats (n = 11) and housed them in an “isolate” environment (rats were housed alone without any tunnels or toys). After 6 weeks, the number of dendritic spines in a particular region of the hippocampus from these rats was imaged and counted. The results are below. Did the different housing conditions have an effect on the number of dendrite branches? Solve using the steps in hypothesis testing. Enriched condition Isolate condition Mean number of dendrites 40 10 (Estimated) Standard Deviation 10 4 Question: Calculate the upper 95% confidence interval…arrow_forwardA neuroscientist is interested in testing the effects of environment on dendritic branching in the hippocampus (dendrites increase the receptivity of neurons and may be an important basis of cognition). To test this, he took one group of rats (n = 11) and housed them in an “enriched” environment (consisting of a large box with tunnels to run through, toys to play with, etc.) and then he took another group of rats (n = 11) and housed them in an “isolate” environment (rats were housed alone without any tunnels or toys). After 6 weeks, the number of dendritic spines in a particular region of the hippocampus from these rats was imaged and counted. The results are below. Did the different housing conditions have an effect on the number of dendrite branches? Solve using the steps in hypothesis testing. Enriched condition Isolate condition Mean number of dendrites 40 10 (Estimated) Standard Deviation 10 4 Question: Calculate the T statisticarrow_forwardA neuroscientist is interested in testing the effects of environment on dendritic branching in the hippocampus (dendrites increase the receptivity of neurons and may be an important basis of cognition). To test this, he took one group of rats (n = 11) and housed them in an “enriched” environment (consisting of a large box with tunnels to run through, toys to play with, etc.) and then he took another group of rats (n = 11) and housed them in an “isolate” environment (rats were housed alone without any tunnels or toys). After 6 weeks, the number of dendritic spines in a particular region of the hippocampus from these rats was imaged and counted. The results are below. Did the different housing conditions have an effect on the number of dendrite branches? Solve using the steps in hypothesis testing. Enriched condition Isolate condition Mean number of dendrites 40 10 (Estimated) Standard Deviation 10 4 Question: Calculate the lower 95% confidence interval…arrow_forward
arrow_back_ios
SEE MORE QUESTIONS
arrow_forward_ios
Recommended textbooks for you
 Algebra & Trigonometry with Analytic GeometryAlgebraISBN:9781133382119Author:SwokowskiPublisher:Cengage
Algebra & Trigonometry with Analytic Geometry
Algebra
ISBN:9781133382119
Author:Swokowski
Publisher:Cengage
Introduction to experimental design and analysis of variance (ANOVA); Author: Dr. Bharatendra Rai;https://www.youtube.com/watch?v=vSFo1MwLoxU;License: Standard YouTube License, CC-BY