
Essentials of Statistics (6th Edition)
6th Edition
ISBN: 9780134685779
Author: Mario F. Triola
Publisher: PEARSON
expand_more
expand_more
format_list_bulleted
Videos
Textbook Question
Chapter 11.2, Problem 15BSC
In Exercises 5–18, test the given claim.
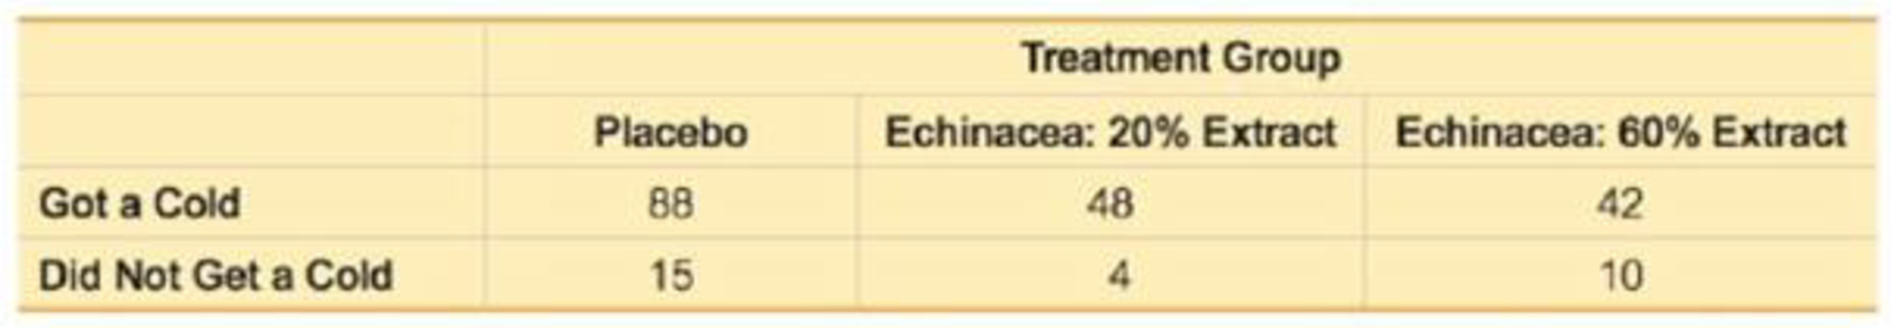
15. Clinical Trial of Echinacea In a clinical trial of the effectiveness of echinacea for preventing colds, the results in the table below were obtained (based on data from “An Evaluation of Echinacea Angustifolia in Experimental Rhinovirus Infections,” by Turner et al., New England Journal of Medicine, Vol. 353, No. 4). Use a 0.05 significance level to test the claim that getting a cold is independent of the treatment group. What do the results suggest about the effectiveness of echinacea as a prevention against colds?
Expert Solution & Answer
Want to see the full answer?
Check out a sample textbook solution
Students have asked these similar questions
Independent random samples of 32 people living on the west side of a city and 30 people living on the east side of a city were taken to determine if the income levels of west side residents are significantly different from the income levels of east side residents. Given the testing statistics below, determine if the data provides sufficient evidence to conclude that the income levels of west side residents are significantly different from the income levels of east side residents, at the 2% significance level.
H0:μw=μeHa:μw≠μe
t0=2.364
t0.01=±2.099
Select the correct answer below:
No; the test statistic is not between the critical values.
No; the test statistic is between the critical values.
Yes; the test statistic is not between the critical values.
Yes; the test statistic is between the critical values.
Independent random samples of 27 people living on the west side of a city and 26 people living on the east side of a city were taken to determine if the income levels of west side residents are less than the income levels of east side residents. Given the testing statistics below, determine if the data provides sufficient evidence to conclude that the income levels of west side residents are less than the income levels of east side residents, at the 4% significance level.
H0:μw≥μeHa:μw<μe
t0=−2.344
t0.04=−2.107
Select the correct answer below:
Yes; the test statistic is greater than the critical value.
No; the test statistic is less than the critical value.
No; the test statistic is greater than the critical value.
Yes; the test statistic is less than the critical value.
Independent random samples of 27 people living on the west side of a city and 26 people living on the east side of a city were taken to determine if the income levels of west side residents are less than the income levels of east side residents. Given the testing statistics below, determine if the data provides sufficient evidence to conclude that the income levels of west side residents are less than the income levels of east side residents, at the 4% significance level.
H0:μw≥μeHa:μw<μe
t0=−2.344
t0.04=−2.107
Chapter 11 Solutions
Essentials of Statistics (6th Edition)
Ch. 11.1 - Cybersecurity The table below lists leading digits...Ch. 11.1 - 2. Cybersecurity When using the data from Exercise...Ch. 11.1 - Cybersecurity The accompanying Statdisk results...Ch. 11.1 - Cybersecurity What do the results from the...Ch. 11.1 - In Exercises 520, conduct the hypothesis test and...Ch. 11.1 - In Exercises 520, conduct the hypothesis test and...Ch. 11.1 - In Exercises 520, conduct the hypothesis test and...Ch. 11.1 - In Exercises 520, conduct the hypothesis test and...Ch. 11.1 - In Exercises 520, conduct the hypothesis test and...Ch. 11.1 - In Exercises 520, conduct the hypothesis test and...
Ch. 11.1 - In Exercises 520, conduct the hypothesis test and...Ch. 11.1 - In Exercises 520, conduct the hypothesis test and...Ch. 11.1 - In Exercises 520, conduct the hypothesis test and...Ch. 11.1 - In Exercises 520, conduct the hypothesis test and...Ch. 11.1 - In Exercises 520, conduct the hypothesis test and...Ch. 11.1 - In Exercises 520, conduct the hypothesis test and...Ch. 11.1 - Ben fords Law. According to Benfords law, a...Ch. 11.1 - Ben fords Law. According to Benfords law, a...Ch. 11.1 - Ben fords Law. According to Benfords law, a...Ch. 11.1 - Ben fords Law. According to Benfords law, a...Ch. 11.1 - Assumed mid-point x=fxn=39825180=221.25...Ch. 11.2 - Handedness and Cell Phone Use The accompanying...Ch. 11.2 - Ear Preference for Cell Phone Use 2. Hypotheses...Ch. 11.2 - Hypothesis Test The accompanying TI-83/84 Plus...Ch. 11.2 - Right-Tailed, Left-Tailed, Two-Tailed Is the...Ch. 11.2 - Prob. 5BSCCh. 11.2 - In Exercises 5-18, test the given claim. 6. Splint...Ch. 11.2 - In Exercises 5-18, test the given claim. 7....Ch. 11.2 - Prob. 8BSCCh. 11.2 - In Exercises 5-18, test the given claim. 9. Four...Ch. 11.2 - In Exercises 5-18, test the given claim. 10....Ch. 11.2 - In Exercises 5-18, test the given claim. 11....Ch. 11.2 - In Exercises 5-18, test the given claim. 12. Nurse...Ch. 11.2 - Soccer Strategy In soccer, serious fouls in the...Ch. 11.2 - In Exercises 5-18, lest the given claim. 14. Is...Ch. 11.2 - In Exercises 518, test the given claim. 15....Ch. 11.2 - In Exercises 5-18, test the given claim. 16....Ch. 11.2 - Prob. 17BSCCh. 11.2 - In Exercises 5-18, test the given claim. 18....Ch. 11.2 - In Exercises 5-18, lest the given claim. 19. Car...Ch. 11.2 - Is the Home Field Advantage Independent of the...Ch. 11.2 - Equivalent Tests A X2 test involving a 2 2 table...Ch. 11.2 - Using Yatess Correction for Continuity The...Ch. 11.3 - In Exercises 1-4, use the following listed arrival...Ch. 11.3 - In Exercises 1-4, use the following listed arrival...Ch. 11.3 - In Exercises 1-4, use the following listed arrival...Ch. 11.3 - In Exercises 1-4, use the following listed arrival...Ch. 11.3 - In Exercises 5-16, use analysis of variance for...Ch. 11.3 - In Exercises 5-16, use analysis of variance for...Ch. 11.3 - In Exercises 5-16, use analysis of variance for...Ch. 11.3 - In Exercises 5-16, use analysis of variance for...Ch. 11.3 - In Exercises 5-16, use analysis of variance for...Ch. 11.3 - Prob. 10BSCCh. 11.3 - Triathlon Times Jeff Parent is a statistics...Ch. 11.3 - Arsenic in Rice Listed below are amounts of...Ch. 11.3 - Prob. 13BSCCh. 11.3 - Speed Dating Listed below are attribute ratings of...Ch. 11.3 - Tukey Test A display of the Bonferroni test...Ch. 11.3 - Two-Way ANOVA The pulse rates in Table 12-3 from...Ch. 11 - Exercises 1-5 refer to the sample data in the...Ch. 11 - Exercises 15 refer to the sample data in the...Ch. 11 - Exercises 15 refer to the sample data in the...Ch. 11 - Prob. 4CQQCh. 11 - Exercises 15 refer to the sample data in the...Ch. 11 - Questions 610 refer to the sample data in the...Ch. 11 - Questions 610 refer to the sample data in the...Ch. 11 - Questions 6-10 refer to the sample data in the...Ch. 11 - Questions 6-10 refer to the sample data in the...Ch. 11 - Motor Vehicle Fatalities The table below lists...Ch. 11 - Tooth Fillings The table below shows results from...Ch. 11 - American Idol Contestants on the TV show American...Ch. 11 - Clinical Trial of Lipitor Lipitor is the trade...Ch. 11 - Weather-Related Deaths For a recent year, the...Ch. 11 - Weather-Related Deaths Review Exercise 5 involved...Ch. 11 - Chocolate and Happiness In a survey sponsored by...Ch. 11 - Chocolate and Happiness Use the results from part...Ch. 11 - Chocolate and Happiness Use the results from part...Ch. 11 - One Big Bill or Many Smaller Bills In a study of...Ch. 11 - 6. Probability Refer to the results from the 150...Ch. 11 - Car Repair Costs Listed below are repair costs (in...Ch. 11 - Forward Grip Reach and Ergonomics When designing...Ch. 11 - Use Statdisk, Minitab, Excel, StatCrunch, a...Ch. 11 - FROM DATA TO DECISION Critical Thinking: Was...Ch. 11 - Cola Weights Data Set 26 Cola Weights and Volumes...Ch. 11 - Speed Dating Data Set 18 Speed Dating in Appendix...Ch. 11 - Author Readability Pages were randomly selected by...
Knowledge Booster


Learn more about
Need a deep-dive on the concept behind this application? Look no further. Learn more about this topic, statistics and related others by exploring similar questions and additional content below.Similar questions
- Independent random samples of 31 people living on the west side of a city and 25 people living on the east side of a city were taken to determine if the income levels of west side residents are greater than the income levels of east side residents. Given the testing statistics below, determine if the data provides sufficient evidence to conclude that the income levels of west side residents are greater than the income levels of east side residents, at the 2% significance level. H0:μw≤μeHa:μw>μe t0=0.511 t0.02=2.104 Select the correct answer below: Yes; the test statistic is greater than the critical value. No; the test statistic is greater than the critical value. No; the test statistic is less than the critical value. Yes; the test statistic is less than the critical value.arrow_forwardThe data below are stress-test scores from 6 nurses from the Emergency Care (EC) unit and 6 nurses from the Long Term (LT) care unit who were randomly selected for the study. The investigator wants to test, at the 5% level, whether there is a difference in stress test scores in the EC group and the LT group. EC LT 5 2 9 3 8 5 10 6 7 4 6 2 State the hypotheses. What statistical test should be used to determine if there is a difference in stress scores between EC and LT nurses? Determine the appropriate critical value and set up the decision rule. Compute the test statistic. Interpret your results. Give your conclusion.arrow_forwardThe General Social Survey polled 1280 men and 1531 women to determine their level of education. The results are presented in the following table. Test at the 0.01 level of significance if education level is independent of gender. Education Level No High School Diploma High School Diploma Associate’s Degree Bachelor’s Degree Graduate Degree Men 178 608 96 248 150 Women 186 827 128 259 131 (a) State the hypotheses. (b) Statetheteststatistic. (c) CalculatetheP-value. (d) Makeadecision. (e) Statetheconclusionaddressingtheoriginalclaim.arrow_forward
- Back in April and May 19 85 the Gallup organization conducted a pool to estimate the percentage of Americans who approved President Reagan was at the 5% significance level to the data suggest that the percentage of those who approved the Reagan increase in 1985? Population 1 April P=795/1528 = 0.5203 Population 2 May P=840/1528 = 0.5497.So all your steps setting up your Null and alternative hypothesisarrow_forwardIn a study of high school students at least 16 years of age, researches obtained data summarized in the table below. Test the claim that texting while driving is independent of drinking alchohol and driving. Assume a significance level of 0.05. Drove when Drinking Did not drive when Drinking Totals Texting while Driving 731 3054 3785 No Texting and Driving 156 4564 4720 Totals 887 7618 8505 c) What is the Alternative Hypothesis? d) Which type of test will be used? e) What critical values are there?arrow_forwardA professor at a large university believes that students take an average of 15 credit hours per term. A random sample of 22 students in her class of 250 students reported the following number of credit hours that they were taking: 12 12 12 13 13 14 14 14 14 15 15 15 16 16 16 16 16 17 17 18 19 21 Does this sample indicate that students are taking more credit hours than the professor believes? Test an appropriate hypothesis and state your conclusion at 5% significance level. Which method will you use to perform the test? Choose the correct one. a1-sample T test b2-sample T test c-sample Z test d-sample T teste- e1proportion Z test.arrow_forward
- Does cable video-on-demand (VOD) increase ad effectiveness? A study compared general TV and VOD audiences after viewing a brand ad. Whether the viewer indicated that the ad made them want to visit the brand website was collected and organized in the accompanying table. Complete parts (a) through (b) below. Test at the 1% level of significance. Set up null and alternative hypotheses to try to determine whether there is a difference in ad impact between general TV viewing and VOD viewing. Let group 1 be the general TV audience, and let group 2 be the VOD audience. State the null and alternative hypotheses. Choose the correct answer below. A. H0: P1<P2 H1: P1≥P2 B. H0: P1=P2 H1: P1≠P2 C. H0: P1≠P2 H1: P1=P2 D. H0: P1≤P2 H1: P1>P2 E. H0: P1>P2 H1: P1≤P2 F. H0: P1≥P2 H1: P1<P2 Calculate the test statistic. Conduct the hypothesis test defined in (a), using the 0.01 level of significance.…arrow_forwardA consumer group complains that the gas tax (in cents per gallon) levied by thefederal, state, and local governments is too high. The following data give the gas tax(in cents per gallon) in 16 metropolitan areas around the country:53 42 42 52 58 42 58 3847 43 59 45 42 49 47 47Assuming normality, test at the 5% level of significance the hypothesis H0: μ =50 versus H1: μ > 50.arrow_forwardA 2020 poll in the Bahamas surveyed 2,400 people about taxing sweetened beverages. The results are provided in the image below and are classified by age group and opinion. a. State both the null and alternative hypotheses. b. Provide the decision rule for making this decision. Use an alpha level of 5%. c. Show all of the work necessary to calculate the appropriate statistic. d. What conclusion are you allowed to draw? e. Would your conclusion change at the 10% level of significance?arrow_forward
- 14.) Using a sample to compute a __________ as a proxy for a parameter is generally called point estimation and is a form of statistical inference.arrow_forward15. Test the claim that the proportion of men who own cats is significantly different than the proportion of women who own cats at the 0.2 significance level.The null and alternative hypothesis would be: H0:pM≥pFH0:pM≥pFH1:pM<pFH1:pM<pF H0:μM≤μFH0:μM≤μFH1:μM>μFH1:μM>μF H0:pM≤pFH0:pM≤pFH1:pM>pFH1:pM>pF H0:pM=pFH0:pM=pFH1:pM≠pFH1:pM≠pF H0:μM=μFH0:μM=μFH1:μM≠μFH1:μM≠μF H0:μM≥μFH0:μM≥μFH1:μM<μFH1:μM<μF The test is left-tailed right-tailed two-tailed Based on a sample of 40 men, 20% owned catsBased on a sample of 40 women, 50% owned cats positive Critical Value = [three decimal accuracy] Test Statistic = [three decimal accuracy] Based on this we: Reject the null hypothesis Fail to reject the null hypothesisarrow_forwardIn order to determine if the average bacteria content of southern flowing streams is less than the average bacteria content of northern flowing streams, independent random samples of 28 southern flowing streams and 35 northern flowing streams were taken. Given the testing statistics below, determine if the data provides sufficient evidence to conclude that the average bacteria content of southern flowing streams is less than the average bacteria content of northern flowing streams, at the 5% significance level. H0:μs≥μnHa:μs<μn t0=−0.108 t0.05=−1.999 Select the correct answer below: No; the test statistic is less than the critical value. Yes; the test statistic is greater than the critical value. No; the test statistic is greater than the critical value. Yes; the test statistic is less than the critical value.arrow_forward
arrow_back_ios
SEE MORE QUESTIONS
arrow_forward_ios
Recommended textbooks for you
 MATLAB: An Introduction with ApplicationsStatisticsISBN:9781119256830Author:Amos GilatPublisher:John Wiley & Sons Inc
 Probability and Statistics for Engineering and th...StatisticsISBN:9781305251809Author:Jay L. DevorePublisher:Cengage Learning
 Statistics for The Behavioral Sciences (MindTap C...StatisticsISBN:9781305504912Author:Frederick J Gravetter, Larry B. WallnauPublisher:Cengage Learning
 Elementary Statistics: Picturing the World (7th E...StatisticsISBN:9780134683416Author:Ron Larson, Betsy FarberPublisher:PEARSON
 The Basic Practice of StatisticsStatisticsISBN:9781319042578Author:David S. Moore, William I. Notz, Michael A. FlignerPublisher:W. H. Freeman
 Introduction to the Practice of StatisticsStatisticsISBN:9781319013387Author:David S. Moore, George P. McCabe, Bruce A. CraigPublisher:W. H. Freeman
MATLAB: An Introduction with Applications
Statistics
ISBN:9781119256830
Author:Amos Gilat
Publisher:John Wiley & Sons Inc
Probability and Statistics for Engineering and th...
Statistics
ISBN:9781305251809
Author:Jay L. Devore
Publisher:Cengage Learning
Statistics for The Behavioral Sciences (MindTap C...
Statistics
ISBN:9781305504912
Author:Frederick J Gravetter, Larry B. Wallnau
Publisher:Cengage Learning
Elementary Statistics: Picturing the World (7th E...
Statistics
ISBN:9780134683416
Author:Ron Larson, Betsy Farber
Publisher:PEARSON
The Basic Practice of Statistics
Statistics
ISBN:9781319042578
Author:David S. Moore, William I. Notz, Michael A. Fligner
Publisher:W. H. Freeman
Introduction to the Practice of Statistics
Statistics
ISBN:9781319013387
Author:David S. Moore, George P. McCabe, Bruce A. Craig
Publisher:W. H. Freeman
Introduction to experimental design and analysis of variance (ANOVA); Author: Dr. Bharatendra Rai;https://www.youtube.com/watch?v=vSFo1MwLoxU;License: Standard YouTube License, CC-BY