
Student Solutions Manual for Devore's Probability and Statistics for Engineering and the Sciences, 9th
9th Edition
ISBN: 9798214004020
Author: Jay L. Devore
Publisher: Cengage Learning US
expand_more
expand_more
format_list_bulleted
Videos
Textbook Question
Chapter 11.4, Problem 40E
In a study of processes used to remove impurities from cellulose goods (“Optimization of Rope-
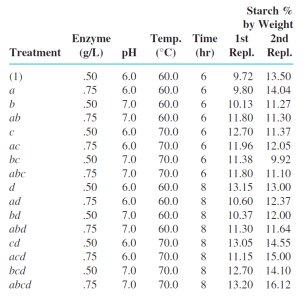
a. Use Yates’s algorithm to obtain sums of squares and the ANOVA table.
b. Do there appear to be any second-, third-, or fourth-order interaction effects present? Explain your reasoning. Which main effects appear to be significant?
Expert Solution & Answer
Want to see the full answer?
Check out a sample textbook solution
Students have asked these similar questions
When factors A and B are fixed but factor C is random and the restricted model is used, and E(MSE) = ²
JKL
1-1 Σa, ²
IKL
J-1
1B, ²
E(MSA) = ² + JLG AC² +
E(MSB) = ² + ILO Bc² +
E(MSC) = 2 + IJLO 2
E(MSAB) = 2 + LO ABC² +
E(MSAC) = ² + JLOAC²
E(MSBC) = 02 + ILO BC
E(MSABC) = 0² + ABC²
MSAB/MSABC
4
(a) Based on these expected mean squares, what F ratios would you use to test the following?
Ho: ABC² = 0
OMSA/MSAC
OMSAC/MSE
OMSABC/MSA
OMSC/MSABC
OMSABC/MSE
OMSA/MSE
OMSC/MSE
ΣΣΑΒ
H₂:0² = 0
O MSC/MSE
KL
(I-1)(J-1) TJ
People are classified as hypertensive if their systolic bloodpressure (SBP) is higher than a specified level for their agegroup, according to the algorithm in Table 5.1.Assume SBP is normally distributed with mean andstandard deviation given in Table 5.1 for age groups 1−14and 15−44, respectively. Define a family as a group of twopeople in age group 1−14 and two people in age group15−44. A family is classified as hypertensive if at least oneadult and at least one child are hypertensive.
5.17) What proportion of 1- to 14-year-olds are hypertensive?
5.18) What proportion of 15- to 44-year-olds are hyper-tensive?
#12
Chapter 11 Solutions
Student Solutions Manual for Devore's Probability and Statistics for Engineering and the Sciences, 9th
Ch. 11.1 - An experiment was carried out to investigate the...Ch. 11.1 - Four different coatings are being considered for...Ch. 11.1 - Prob. 3ECh. 11.1 - In an experiment to see whether the amount of...Ch. 11.1 - In an experiment to assess the effect of the angle...Ch. 11.1 - A particular county employs three assessors who...Ch. 11.1 - Prob. 7ECh. 11.1 - The paper Exercise Thermoregulation and...Ch. 11.1 - The article The Effects of a Pneumatic Stool and a...Ch. 11.1 - Prob. 10E
Ch. 11.1 - Prob. 11ECh. 11.1 - Prob. 12ECh. 11.1 - Prob. 13ECh. 11.1 - Prob. 14ECh. 11.1 - The power curves of Figures 10.5 and 10.6 can be...Ch. 11.2 - In an experiment to assess the effects of curing...Ch. 11.2 - Prob. 17ECh. 11.2 - The accompanying data resulted from an experiment...Ch. 11.2 - A two-way ANOVA was carried out to assess the...Ch. 11.2 - The article Fatigue Limits of Enamel Bonds with...Ch. 11.2 - In an experiment to investigate the effect of...Ch. 11.2 - Prob. 22ECh. 11.2 - Prob. 23ECh. 11.2 - Prob. 24ECh. 11.2 - Prob. 25ECh. 11.2 - Prob. 26ECh. 11.3 - The output of a continuous extruding machine that...Ch. 11.3 - Prob. 28ECh. 11.3 - Prob. 29ECh. 11.3 - Prob. 30ECh. 11.3 - Nickel titanium (NiTi) shape memory alloy (SMA)...Ch. 11.3 - Prob. 32ECh. 11.3 - Prob. 33ECh. 11.3 - The article The Responsiveness of Food Sales to...Ch. 11.3 - Prob. 35ECh. 11.3 - Prob. 36ECh. 11.3 - Prob. 37ECh. 11.4 - The accompanying data resulted from an experiment...Ch. 11.4 - The accompanying data resulted from a 23...Ch. 11.4 - In a study of processes used to remove impurities...Ch. 11.4 - Prob. 41ECh. 11.4 - Prob. 42ECh. 11.4 - Prob. 43ECh. 11.4 - a. In a 24 experiment, suppose two blocks are to...Ch. 11.4 - a. An experiment was carried out to investigate...Ch. 11.4 - Prob. 46ECh. 11.4 - a. In a seven-factor experiment (A,, G), suppose a...Ch. 11.4 - The article Applying Design of Experiments to...Ch. 11 - The results of a study on the effectiveness of...Ch. 11 - Prob. 51SECh. 11 - Prob. 52SECh. 11 - In an automated chemical coating process, the...Ch. 11 - Coal-fired power plants used in the electrical...Ch. 11 - Impurities in the form of iron oxides lower the...Ch. 11 - Factorial designs have been used in forestry to...Ch. 11 - Prob. 57SECh. 11 - Prob. 58SECh. 11 - The bond strength when mounting an integrated...Ch. 11 - Prob. 60SECh. 11 - Prob. 61SE
Knowledge Booster


Learn more about
Need a deep-dive on the concept behind this application? Look no further. Learn more about this topic, statistics and related others by exploring similar questions and additional content below.Similar questions
- Spgarrow_forward40. In a study of processes used to remove impurities from cellulose goods ("Optimization of Rope- Range Bleaching of Cellulosic Fabrics," Textile Research J., 1976: 493-496), the following data resulted from a 2 experiment involving the desiz- ing process. The four factors were enzyme concentration (A), pH (B), temperature (C), and time (D). Starch % by Weight En- Treat- zyme ment (gL) pH (C) Temp. Time 1st 2nd (hr) Repl. Repl. (1) a. b. 60.0 60.0 60.0 6. 9.80 14.04 6. 50 .75 50 .75 50 .75 50 75 50 6.0 6.0 9.72 13.50 10.13 11.27 7.0 60.0 70.0 ab 7.0 6. 11.80 11.30 6.0 6. 12.70 11.37 ac 6.0 70.0 6. 11.96 12.05 6. 11.38 9.92 70.0 70.0 60.0 60.0 60.0 60.0 70.0 70.0 70.0 70.0 be 7.0 7.0 abc. 6. 11.80 11.10 13.15 13.00 10.60 12.37 10.37 12.00 11.30 11.64 13.05 14.55 11.15 15.00 6.0 .75 ad bd abd 6.0 50 .75 7.0 7.0 6.0 6.0 7.0 7.0 cd acd 50 .75 50 8. 12.70 14.10 13.20 16.12 bcd abcd .75 a Use Yates's algorithm to obtain sums of squares and the ANOVA table. b. Do there appear to be any…arrow_forwardYou work for an insurance company and are studying the relationship between types of crashes and the vehicles involved. As part of your study, you randomly select 3589 vehicle crashes and organize the resulting data as shown in the contigency table. At α=0.10, can you conclude that the type of crash depends on the type of vehicle? Complete parts (a) through (d). Vehicle Type of crash Car Pickup Sport utility Single-vehicle 866 323 340 Multiple-vehicle 1145 487 428 Question content area bottom Part 1 (a) Identify the claim and state the null and alternative hypotheses. H0: The type of crash and the type of vehicle are ▼ independent dependent . Ha: The type of crash and the type of vehicle are ▼ dependent independent . The ▼ alternative hypothesis null hypothesis is the claim.arrow_forward
- You work for an insurance company and are studying the relationship between types of crashes and the vehicles involved. As part of your study, you randomly select 3589 vehicle crashes and organize the resulting data as shown in the contigency table. At α=0.10, can you conclude that the type of crash depends on the type of vehicle? Complete parts (a) through (d). Vehicle Type of crash Car Pickup Sport utility Single-vehicle 866 323 340 Multiple-vehicle 1145 487 428 Question content area bottom Part 1 (a) Identify the claim and state the null and alternative hypotheses. H0: The type of crash and the type of vehicle are ▼ independent dependent Ha: The type of crash and the type of vehicle are ▼ dependent independent The ▼ alternative hypothesis null hypothesis is the claim. H0: The type of crash and the type of vehicle are Ha: The type of crash and the type of vehicle are Determine…arrow_forwardYou work for an insurance company and are studying the relationship between types of crashes and the vehicles involved. As part of your study, you randomly select 3632 vehicle crashes and organize the resulting data as shown in the contigency table. At α=0.01, can you conclude that the type of crash depends on the type of vehicle? Complete parts (a) through (d). Vehicle Type of crash Car Pickup Sport utility Single-vehicle 876 393 342 Multiple-vehicle 1143 475 403 Question content area bottom Part 1 (a) Identify the claim and state the null and alternative hypotheses. H0: The type of crash and the type of vehicle are . Ha: The type of crash and the type of vehicle are . (a) Identify the claim and state the null and alternative hypotheses. H0: The type of crash and the type of vehicle are Ha: The type of crash and the type of vehicle are . The alternative hypothesis is the claim. Part 2 (b) Determine the degrees of…arrow_forward1,carrow_forward
- Each of 100 individuals of a mammal species was placed in enclosure containing equal amount of each of five different foods. The frequency with which the animals chose each of the foods was: Sample 1 fi 18 Sample 2 fi Food item (i) 1 7 20 20 3 17 46 4 21 24 18 (a) Calculate the Shannon-Wiener diversity index and evenness index for each sample. (b) Which sample has higher diversity? (c) Describe a sample frequency (of n = 100) that achieve the highest diversity.arrow_forwardA study of accident records at a large engineering company in England reported the following number of injuries on each shift for 1 year: Shift: Number of injuries: Morning 1372 Afternoon 1578 Night 1686 Is there sufficient evidence to say that the numbers of accidents on the three shifts are not the same? Test at the 0.05, 0.01, and 0.001 levels. (a) There is sufficient evidence at all three levels to say that the numbers of accidents on each shift are not the same. (b) There is sufficient evidence at the 0.05 and 0.01 levels but not at the 0.001 level. (c) There is sufficient evidence at the 0.05 level but not at the 0.01 or 0.001 levels. (d) There is sufficient evidence at the 0.001 level but not at the 0.01 or 0.05 levels. (e) There is insufficient evidence at any of these levels.arrow_forwardIndiana University posts the grade distributions for its courses online."' In one spring semester, students in Math 118 received 16.1% As, 34.3% B's, 29.2% Cs, 9.6% D's, and 9.8% F's. Math 118 is a large enough course that we can take the grades of an SRS of 25 students and not worry about the finite population correction factor. If x is the average of these 25 grades, what are the mean and standard deviation of x?arrow_forward
- 2. Members of the research and development division of a bicycle tire manufacturer are investigating tread life of rubber bicycle tires. They have suggested that a study be conducted to determine whether bicycle tires produced using a new synthetic rubber compound have a longer tread life than the tread life of bicycle tires produced using the standard rubber compound. A researcher in the division suggested the study be designed in the following way. Select 60 identical bicycles and randomly assign 30 of those bicycles to one group, A, and the rest to a second group, B. All 60 bicycles will be equipped with front tires produced using the standard rubber compound. However, the bicycles in group A will be equipped with rear tires produced using the new synthetic rubber compound, while the bicycles in group B will be equipped with rear tires produced using the standard rubber compound. A total of 60 bicyclists will be randomly selected from the population of students at a local university…arrow_forward3. Early Detection of Breast Cancer Of those women who are diagnosed to have early-stage breast cancer, one-third eventually die of the disease. Suppose a community public health department instituted a screening program to provide for the early detection of breast cancer and to increase the survival rate p of those diagnosed to have the disease. A random sample of 200 women was selected from among those who were periodically screened by the program and who were diagnosed to have the disease. Let x represent the number of those in the sample who survive the disease. a. If you wish to detect whether the community screening program has been effective, state the null hypothesis that should be tested. b. State the alternative hypothesis. c. If 164 women in the sample of 200 survive the disease, can you conclude that the community screening program was effective? Test using a= 0.05 and explain the practical conclusions from your test. Find the p-value for the test and interpret it. d.arrow_forwardb) The number of planes to arrive at the Dubai International Airport over N days were recorded and inputted into MINITAB for analysis. Exhibit 1 was subsequently generated. Exhibit 1 Stem-and-Leaf Display: No. of Arrival Leaf Unit 1 N =* 5 2 01123 10 2 56899 ** 3 0001123 (*** ) 3 6666678888 12 4 01134 7 4 57789 5 00 c) Using the stem and leaf diagram in Exhibit 1, i. Form a frequency table by identifying the class intervals implicitly Using the table created in 2ci) above, 1. Calculate the sample mean 111. Calculate the sample variancearrow_forward
arrow_back_ios
SEE MORE QUESTIONS
arrow_forward_ios
Recommended textbooks for you
 MATLAB: An Introduction with ApplicationsStatisticsISBN:9781119256830Author:Amos GilatPublisher:John Wiley & Sons Inc
 Probability and Statistics for Engineering and th...StatisticsISBN:9781305251809Author:Jay L. DevorePublisher:Cengage Learning
 Statistics for The Behavioral Sciences (MindTap C...StatisticsISBN:9781305504912Author:Frederick J Gravetter, Larry B. WallnauPublisher:Cengage Learning
 Elementary Statistics: Picturing the World (7th E...StatisticsISBN:9780134683416Author:Ron Larson, Betsy FarberPublisher:PEARSON
 The Basic Practice of StatisticsStatisticsISBN:9781319042578Author:David S. Moore, William I. Notz, Michael A. FlignerPublisher:W. H. Freeman
 Introduction to the Practice of StatisticsStatisticsISBN:9781319013387Author:David S. Moore, George P. McCabe, Bruce A. CraigPublisher:W. H. Freeman
MATLAB: An Introduction with Applications
Statistics
ISBN:9781119256830
Author:Amos Gilat
Publisher:John Wiley & Sons Inc
Probability and Statistics for Engineering and th...
Statistics
ISBN:9781305251809
Author:Jay L. Devore
Publisher:Cengage Learning
Statistics for The Behavioral Sciences (MindTap C...
Statistics
ISBN:9781305504912
Author:Frederick J Gravetter, Larry B. Wallnau
Publisher:Cengage Learning
Elementary Statistics: Picturing the World (7th E...
Statistics
ISBN:9780134683416
Author:Ron Larson, Betsy Farber
Publisher:PEARSON
The Basic Practice of Statistics
Statistics
ISBN:9781319042578
Author:David S. Moore, William I. Notz, Michael A. Fligner
Publisher:W. H. Freeman
Introduction to the Practice of Statistics
Statistics
ISBN:9781319013387
Author:David S. Moore, George P. McCabe, Bruce A. Craig
Publisher:W. H. Freeman
Hypothesis Testing using Confidence Interval Approach; Author: BUM2413 Applied Statistics UMP;https://www.youtube.com/watch?v=Hq1l3e9pLyY;License: Standard YouTube License, CC-BY
Hypothesis Testing - Difference of Two Means - Student's -Distribution & Normal Distribution; Author: The Organic Chemistry Tutor;https://www.youtube.com/watch?v=UcZwyzwWU7o;License: Standard Youtube License