
Essentials of Statistics Books a la carte Plus NEW MyLab Statistics with Pearson eText - Access Card Package (5th Edition)
5th Edition
ISBN: 9780133892697
Author: Mario F. Triola
Publisher: PEARSON
expand_more
expand_more
format_list_bulleted
Videos
Textbook Question
Chapter 11.4, Problem 9BSC
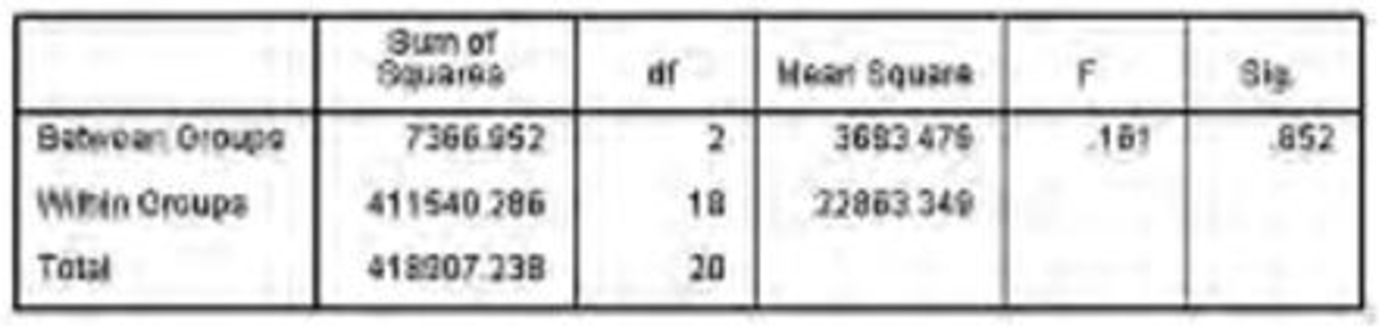
Head Injury Crash Test Data Exercises 1–4 use chest deceleration data for three different size categories (small, midsize, large). The data are from a standard crash test and they are listed in Data Set 13 in Appendix B. If we use the head injury measurements (in HIC, which is a standard head injury criterion) with the same three size categories, we get the SPSS results shown here. Using a 0.05 significance level, test the claim that the three size categories have the same
SPSS
Expert Solution & Answer
Want to see the full answer?
Check out a sample textbook solution
Students have asked these similar questions
Information regarding the ACT scores of samples of students in three different majors is given below.
Major
Management
Finance
Accounting
Sample size
12
10
18
Average
24
26
27
Sample variance
18
6
10
a.
Compute the overall sample mean x
b.
Set up the ANOVA table for this problem including the test statistic. Include all qork
c.
Using a = .05, determine the range of critical values for F.
d.
Using the critical value approach, test to determine whether there is a significant difference in the means of the three populations within the context of this scenario.
Watch Corporation of Switzerland claims that its watches on average will neither gain nor lose time during a week. A sample of 18 watches provided the following gains (+) or losses (−) in seconds per week.
Click here for the Excel Data File
−0.38
−0.29
−0.34
−0.23
+0.41
−0.24
+0.34
+0.52
−0.13
−0.29
−0.38
−0.48
−0.55
−0.69
−0.09
−0.23
−0.34
+0.04
State the null hypothesis and the alternate hypothesis.
State the decision rule for 0.01 significance level. (Negative amounts should be indicated by a minus sign. Round your answers to 3 decimal places.)
This data set contains the achievement test (English as a Second Language) results and some background data collected during experimental trial of a new ESL program. The study was one year in duration. Students were allocated to the experimental ESL program class and a regular program control class on a random basis. Vocabulary and grammar tests were administered to the students in both groups at the beginning and the end of the school year.
Variables
The dataset includes 24 cases and 7 variables:
▪ Student ID
▪ Group (1 - experimental, 2 - control, 9 - missing)
▪ Gender (1 - male, 2 - female, 9 - missing)
▪ Pre-test vocabulary scores (scores range from 0 - 25, 99 - missing)
▪ Pre-test grammar scores (scores range from 0 - 25, 99 - missing)
▪ Post-test vocabulary scores (scores range from 0 - 25, 99 - missing)
▪ Post-test grammar scores (scores range from 0 - 25, 99 - missing)
Provide a codebook with the following four columns: (1) Variable name; (2) Variable label; (3) Value &…
Chapter 11 Solutions
Essentials of Statistics Books a la carte Plus NEW MyLab Statistics with Pearson eText - Access Card Package (5th Edition)
Ch. 11.2 - Prob. 1BSCCh. 11.2 - Prob. 2BSCCh. 11.2 - Prob. 3BSCCh. 11.2 - Prob. 4BSCCh. 11.2 - Prob. 5BSCCh. 11.2 - Prob. 6BSCCh. 11.2 - In Exercises 5-20, conduct the hypothesis test and...Ch. 11.2 - In Exercises 5-20, conduct the hypothesis test and...Ch. 11.2 - Prob. 9BSCCh. 11.2 - In Exercises 5-20, conduct the hypothesis test and...
Ch. 11.2 - Prob. 11BSCCh. 11.2 - In Exercises 5-20, conduct the hypothesis test and...Ch. 11.2 - Prob. 13BSCCh. 11.2 - Prob. 14BSCCh. 11.2 - In Exercises 5-20, conduct the hypothesis test and...Ch. 11.2 - In Exercises 5-20, conduct the hypothesis test and...Ch. 11.2 - Prob. 17BSCCh. 11.2 - American Idol Contestants on the TV show American...Ch. 11.2 - In Exercises 5-20, conduct the hypothesis test and...Ch. 11.2 - Prob. 20BSCCh. 11.2 - Prob. 21BSCCh. 11.2 - Prob. 22BSCCh. 11.2 - Benfords Law. According to Benfords law, a variety...Ch. 11.2 - Prob. 24BSCCh. 11.2 - Testing Goodness-of-Fit with a Normal Distribution...Ch. 11.3 - Smoking Cessation The accompanying table...Ch. 11.3 - Prob. 2BSCCh. 11.3 - Degrees of Freedom and Critical Value For the...Ch. 11.3 - Prob. 4BSCCh. 11.3 - Prob. 5BSCCh. 11.3 - Prob. 6BSCCh. 11.3 - Prob. 7BSCCh. 11.3 - Prob. 8BSCCh. 11.3 - In Exercises 5-18, test the given claim. 9. Is...Ch. 11.3 - Prob. 10BSCCh. 11.3 - In Exercises 5-18, test the given claim. 11....Ch. 11.3 - Prob. 12BSCCh. 11.3 - Soccer Strategy In soccer, serious fouls in the...Ch. 11.3 - Prob. 14BSCCh. 11.3 - Prob. 15BSCCh. 11.3 - In Exercises 5-18, test the given claim. 16....Ch. 11.3 - Prob. 17BSCCh. 11.3 - Prob. 18BSCCh. 11.3 - Prob. 19BSCCh. 11.3 - Prob. 20BSCCh. 11.3 - Prob. 21BBCh. 11.3 - Using Yatess Correction for Continuity The...Ch. 11.4 - In Exercises 1-4, use the following listed chest...Ch. 11.4 - Prob. 2BSCCh. 11.4 - In Exercises 1-4, use the following listed chest...Ch. 11.4 - Prob. 4BSCCh. 11.4 - In Exercises 516, use analysis of variance for the...Ch. 11.4 - In Exercises 516, use analysis of variance for the...Ch. 11.4 - Highway Fuel Consumption Data Set 14 in Appendix B...Ch. 11.4 - City Fuel Consumption Data Set 14 in Appendix B...Ch. 11.4 - Head Injury Crash Test Data Exercises 14 use chest...Ch. 11.4 - Pelvis Injury Crash Test Data Exercises 14 use...Ch. 11.4 - Prob. 11BSCCh. 11.4 - Prob. 12BSCCh. 11.4 - Prob. 13BSCCh. 11.4 - Prob. 14BSCCh. 11.4 - Prob. 15BSCCh. 11.4 - Prob. 16BSCCh. 11.4 - Tukey Test A display of the Bonferroni test...Ch. 11 - Prob. 1CQQCh. 11 - Prob. 2CQQCh. 11 - Questions 1-5 refer to the sample data in the...Ch. 11 - Prob. 4CQQCh. 11 - Prob. 5CQQCh. 11 - Prob. 6CQQCh. 11 - Prob. 7CQQCh. 11 - Prob. 8CQQCh. 11 - Prob. 9CQQCh. 11 - Questions 6-10 refer to the sample data in the...Ch. 11 - Auto Fatalities The table below lists auto...Ch. 11 - Prob. 2RECh. 11 - Prob. 3RECh. 11 - Prob. 4RECh. 11 - Prob. 5RECh. 11 - Home Field Advantage Winning-team data were...Ch. 11 - Prob. 7RECh. 11 - Prob. 1CRECh. 11 - Prob. 2CRECh. 11 - ICU Patients Listed below are the ages of randomly...Ch. 11 - Prob. 4CRECh. 11 - Boats and Manatees The table below lists the...Ch. 11 - Forward Grip Reach and Ergonomics When designing...Ch. 11 - Honesty Is the Best Policy In a USA Today survey...Ch. 11 - Probability and Honesty Based on the sample...Ch. 11 - Use Statdisk, Minitab, Excel, StatCrunch, a...Ch. 11 - Prob. 1FDD
Knowledge Booster


Learn more about
Need a deep-dive on the concept behind this application? Look no further. Learn more about this topic, statistics and related others by exploring similar questions and additional content below.Similar questions
- What is meant by the sample space of an experiment?arrow_forwardThis data set contains the achievement test (English as a Second Language) results and some background data collected during experimental trial of a new ESL program. The study was one year in duration. Students were allocated to the experimental ESL program class and a regular program control class on a random basis. Vocabulary and grammar tests were administered to the students in both groups at the beginning and the end of the school year. Variables The dataset includes 24 cases and 7 variables: Student ID Group (1 - experimental, 2 - control, 9 - missing) Gender (1 - male, 2 - female, 9 - missing) Pre-test vocabulary scores (scores range from 0 - 25, 99 - missing) Pre-test grammar scores (scores range from 0 - 25, 99 - missing) Post-test vocabulary scores (scores range from 0 - 25, 99 - missing) Post-test grammar scores (scores range from 0 - 25, 99 - missing) (a) develop a research question that can be addressed with independent-samples t test (b) state the null and alternative…arrow_forwardQSR Magazine published the latest results of its annual quick serve resturant drive-thru study. One aspect of the study examined the customer drive-thru wait times for various brands. The drive-thru wait times for random samples of customers at Chick-fil-A, McDonald's, and KFC are given in the table below. Brand Customers drive-thru wait times (in seconds) Chick-fil-A 485 496 489 460 487 477 495 McDonald's 356 362 343 327 369 351 350 KFC 291 269 251 283 286 294 278 (a) Conduct a hypothesis test using a=0.05 to determine whether the mean drive-thru wait times of customers at Chick-fila-A, and KFC are the same. Assume that drive thru wait times for each of these brands reasonably follow a normal distribution. (b) Use the sample data collected in Problem 4 to construct…arrow_forward
- The U.S. Federal Bureau of Investigation compiles data on crimes and crime rates. A violent crime is classified as Murder, Forcible Rape, Robbery, and Aggravated Assault. Relative Frequency distribution for Violent crimes in 2010 Murder. 1.1% Forcible Rape 6.3% Robbery 28.6% Aggravated Assault. 64% To compare the distribution of crimes between the year 2010 and 2020, a sample of 500 violent crimes were randomly selected: Murder 3 Forcible Rape 37 Robbery 154 Aggravated Assault. 306 Perform a hypothesis test at the 5% significance level to determine if the distribution of violent crimes in 2020 has changed from the distribution in 2010. 1) State null and alternative hypothesis 2) Find Test Statistics 3) Find the p-value 4) Conclusionarrow_forwardThe National Visitor Survey (Case Study) The Bureau of Tourism Research National Visitor Survey (NVS) began operations in January 1998, replacing the Domestic Tourism Monitor (DTM), which had been conducted since the late 1970s. According to Barry (1999), the introduction of the new survey was initiated as a result of the recognition that: travel patterns had changed considerably • the utility of the DTM statistics was restricted by small sample size and limited topic coverage • there was a need for research into overseas travel, regional visitation, expenditure, accommodation choice and niche markets. Australian tourism industry personnel expressed concern about this changeover, but the NVS appears to be a superior survey in several respects. The most important improvement lies in the reliability of the information generated, with an increase in sample size from the DTM's 65000 to 80000. The States and Territories are not represented proportionally in the overall sample, since those…arrow_forwardUse the data cited in Exercise 5.3.1. Imagine we take samples of size 5, 25, 50, 100, and 500 from the women in this age group. (a) Calculate the standard error for each of these sampling scenarios. (b) Discuss how sample size affects the standard error estimates calculated in part (a) and the potential implications this may have in statistical practice. Exercise 5.3.1 The National Health and Nutrition Examination Survey of 1988–1994 (NHANES III, A-1) estimated the mean serum cholesterol level for U.S. females aged 20–74 years to be 204 mg/dl. The estimate of the standard deviation was approximately 44. Using these estimates as the mean m and standard deviation s for the U.S. population, consider the sampling distribution of the sample mean based on samples of size 50 drawn from women in this age group. What is the mean of the sampling distribution? The standard error?arrow_forward
- In the article “The Eastern Cottonmouth (Agkistrodon piscivorus) at the Northern Edge of Its Range” (Journal of Herpetology, Vol. 29, No. 3, pp. 391–398), Blem and Blem examined the reproductive characteristics of the eastern cottonmouth, a once widely distributed snake whose numbers have decreased recently due to encroachment by humans. A simple random sample of 44 female cottonmouths yielded a sample mean of ??̅ = 7.6 young per litter. Assume σ = 2.4. a. Is the sample mean likely to equal μ exactly? Explain your answer b. Find the 95% Confidence Interval. c. How large a sample would be needed to get at 99% confidence interval with a margin of error of just 0.1?arrow_forwardThe required ANOVA assumptions are(a) independent, simple random samples; equal sample sizes; equal population (or treatment)means.(b) equal sample sizes and normality.(c) equal population (or treatment) variances and equal sample sizes.(d) independent, simple random samples; equal population (or treatment) variances; normality.arrow_forwardEighteen participants took part in an experimental study that consisted of three levels: normal classroom teaching, normal classroom teaching with tutors, and an experimental teaching method to increase student scores on a statistics exam. Your data set includes the following variables: Treatment (1 - normal classroom teaching; 2 - normal classroom teaching with tutors; 3 - experimental teaching method) Gender (1 – female; 2 – male) Pre-test score (higher scores represent better student performance on a statistics exam) Post-test score (higher scores represent better student performance on a statistics exam) Stanford-Binet Intelligence Test scores (IQ) The number of hours the student studied per week. Do test scores at pre-treatment differ from test scores at post-treatment? Note, this analysis should be conducted ignoring the treatment group they are in. Select an appropriate statistical test and state teh hullhypothesis.arrow_forward
arrow_back_ios
arrow_forward_ios
Recommended textbooks for you
 Glencoe Algebra 1, Student Edition, 9780079039897...AlgebraISBN:9780079039897Author:CarterPublisher:McGraw Hill
 College Algebra (MindTap Course List)AlgebraISBN:9781305652231Author:R. David Gustafson, Jeff HughesPublisher:Cengage Learning
Glencoe Algebra 1, Student Edition, 9780079039897...
Algebra
ISBN:9780079039897
Author:Carter
Publisher:McGraw Hill
College Algebra (MindTap Course List)
Algebra
ISBN:9781305652231
Author:R. David Gustafson, Jeff Hughes
Publisher:Cengage Learning
Hypothesis Testing using Confidence Interval Approach; Author: BUM2413 Applied Statistics UMP;https://www.youtube.com/watch?v=Hq1l3e9pLyY;License: Standard YouTube License, CC-BY
Hypothesis Testing - Difference of Two Means - Student's -Distribution & Normal Distribution; Author: The Organic Chemistry Tutor;https://www.youtube.com/watch?v=UcZwyzwWU7o;License: Standard Youtube License