
a)
The graph that shows a profit-maximizing price and quantity and a shaded area of loss along with
a)
Explanation of Solution
The following graph shows a profit-maximizing price and quantity, shaded area of loss, and allocatively efficient quantity:
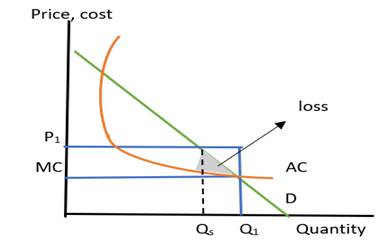
In this graph, the horizontal axis represents the quantity and the vertical axis shows the price and cost.
- The profit-maximizing quantity is shown as the maximum quantity at a price which is labeled by Q1 on the graph.
- The profit-maximizing price is available at the vertical axis above marginal cost which produces maximum profits for the firm and it is labeled by P1
- The area of the firm’s loss is shaded below the demand curve and above the optimum quantity where quantity is sold below the maximum price.
- Allocatively efficient quantity is at the point where the demand and marginal cost are equal and is labeled by Qs
Introduction: The market structure can be determined by a number of factors such as the number of buyers, sellers, competition, and barriers or freedom to enter or exit. Profit maximization is the situation where a firm earns maximum profit in the market.
b)
The effect of the subsidy on the firm’s output when it is assumed that the firm would continue to operate with or without the subsidy.
b)
Explanation of Solution
An industry can enable its manufacturers to generate more goods and services when the government executes subsidies. However, this expands the overall supply of that commodity or service, which raises demand for it and decreases the overall cost of the good or service by increasing the quantity that is sought after. The supply curve will skew to the right as a result of a subsidy, lowering the
Therefore, in a natural
Introduction: The market structure can be determined by a number of factors such as the number of buyers, sellers, competition, and barriers or freedom to enter or exit. A payment made to businesses or consumers to promote an increase in output is called a subsidy.
Chapter 11R Solutions
Krugman's Economics For The Ap® Course


 Principles of Economics (12th Edition)EconomicsISBN:9780134078779Author:Karl E. Case, Ray C. Fair, Sharon E. OsterPublisher:PEARSON
 Engineering Economy (17th Edition)EconomicsISBN:9780134870069Author:William G. Sullivan, Elin M. Wicks, C. Patrick KoellingPublisher:PEARSON
 Principles of Economics (MindTap Course List)EconomicsISBN:9781305585126Author:N. Gregory MankiwPublisher:Cengage Learning
 Managerial Economics: A Problem Solving ApproachEconomicsISBN:9781337106665Author:Luke M. Froeb, Brian T. McCann, Michael R. Ward, Mike ShorPublisher:Cengage Learning
 Managerial Economics & Business Strategy (Mcgraw-...EconomicsISBN:9781259290619Author:Michael Baye, Jeff PrincePublisher:McGraw-Hill Education