
(a)
To determine: The characteristic infrared absorptions of the functional groups in the given molecule.
Interpretation: The characteristic infrared absorptions of the functional groups in the given molecule are to be predicted.
Concept introduction: An IR spectrum is a graph for the energy absorbed by a molecule as a function of the frequency or
(a)
Answer to Problem 12.12SP
The characteristic infrared absorptions of the functional groups in the given molecule are,
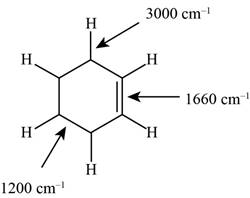
Figure 1
Explanation of Solution
The structure of the given molecule is,

Figure 2
The possibilities of the IR stretching frequencies for the given molecule are shown as,

Figure 1
So, the stretching frequencies of
(b)
To determine: The characteristic infrared absorptions of the functional groups in the given molecule.
Interpretation: The characteristic infrared absorptions of the functional groups in the given molecule are to be predicted.
Concept introduction: An IR spectrum is a graph for the energy absorbed by a molecule as a function of the frequency or wavelength of light. Alkanes, alkenes and alkynes have characteristic
(b)
Answer to Problem 12.12SP
The characteristic infrared absorptions of the functional groups in the given molecule are,

Figure 3
Explanation of Solution
The structure of the given molecule is,
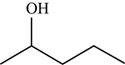
Figure 4
The possibilities of the IR stretching frequencies for the given molecule are shown as,
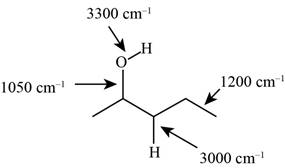
Figure 3
So, the stretching frequencies of
(c)
To determine: The characteristic infrared absorptions of the functional groups in the given molecule.
Interpretation: The characteristic infrared absorptions of the functional groups in the given molecule are to be predicted.
Concept introduction: An IR spectrum is a graph for the energy absorbed by a molecule as a function of the frequency or wavelength of light. Alkanes, alkenes and alkynes have characteristic
(c)
Answer to Problem 12.12SP
The characteristic infrared absorptions of the functional groups in the given molecule are,

Figure 5
Explanation of Solution
The structure of the given molecule is,
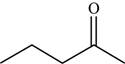
Figure 6
The possibilities of the IR stretching frequencies for the given molecule are shown as,
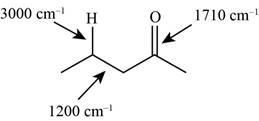
Figure 5
So, the stretching frequencies of
(d)
To determine: The characteristic infrared absorptions of the functional groups in the given molecule.
Interpretation: The characteristic infrared absorptions of the functional groups in the given molecule are to be predicted.
Concept introduction: An IR spectrum is a graph for the energy absorbed by a molecule as a function of the frequency or wavelength of light. Alkanes, alkenes and alkynes have characteristic
(d)
Answer to Problem 12.12SP
The characteristic infrared absorptions of the functional groups in the given molecule are,
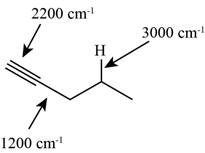
Figure 7
Explanation of Solution
The structure of the given molecule is,
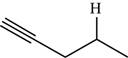
Figure 8
The possibilities of the IR stretching frequencies for the given molecule are shown as,
Figure 7
So, the stretching frequencies of
(e)
To determine: The characteristic infrared absorptions of the functional groups in the given molecule.
Interpretation: The characteristic infrared absorptions of the functional groups in the given molecule are to be predicted.
Concept introduction: An IR spectrum is a graph for the energy absorbed by a molecule as a function of the frequency or wavelength of light. Alkanes, alkenes and alkynes have characteristic
(e)
Answer to Problem 12.12SP
The characteristic infrared absorptions of the functional groups in the given molecule are,
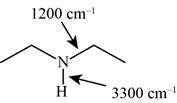
Figure 9
Explanation of Solution
The structure of the given molecule is,
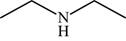
Figure 10
The possibilities of the IR stretching frequencies for the given molecule are shown as,

Figure 9
So, the stretching frequencies of
(f)
To determine: The characteristic infrared absorptions of the functional groups in the given molecule.
Interpretation: The characteristic infrared absorptions of the functional groups in the given molecule is to be predicted.
Concept introduction: An IR spectrum is a graph for the energy absorbed by a molecule as a function of the frequency or wavelength of light. Alkanes, alkenes and alkynes have characteristic
(f)
Answer to Problem 12.12SP
The characteristic infrared absorptions of the functional groups in the given molecule are,
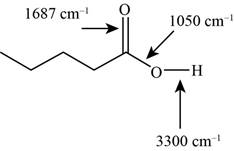
Figure 11
Explanation of Solution
The structure of the given molecule is,
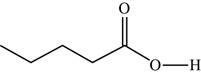
Figure 12
The possibilities of the IR stretching frequencies for the given molecule are shown as,
Figure 11
So, the stretching frequencies of
(g)
To determine: The characteristic infrared absorptions of the functional groups in the given molecule.
Interpretation: The characteristic infrared absorptions of the functional groups in the given molecule are to be predicted.
Concept introduction: An IR spectrum is a graph for the energy absorbed by a molecule as a function of the frequency or wavelength of light. Alkanes, alkenes and alkynes have characteristic
(g)
Answer to Problem 12.12SP
The characteristic infrared absorptions of the functional groups in the given molecule are,
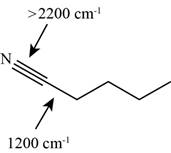
Figure 13
Explanation of Solution
The structure of the given molecule is,
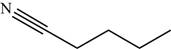
Figure 14
The possibilities of the IR stretching frequencies for the given molecule are shown as,

Figure 13
So, the stretching frequencies of
(h)
To determine: The characteristic infrared absorptions of the functional groups in the given molecule.
Interpretation: The characteristic infrared absorptions of the functional groups in the given molecule are to be predicted.
Concept introduction: An IR spectrum is a graph for the energy absorbed by a molecule as a function of the frequency or wavelength of light. Alkanes, alkenes and alkynes have characteristic
(h)
Answer to Problem 12.12SP
The characteristic infrared absorptions of the functional groups in the given molecule are,
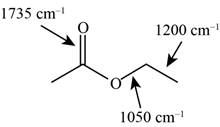
Figure 15
Explanation of Solution
The structure of the given molecule is,
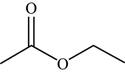
Figure 16
The possibilities of the IR stretching frequencies for the given molecule are shown as,

Figure 15
So, the stretching frequencies of
(i)
To determine: The characteristic infrared absorptions of the functional groups in the given molecule.
Interpretation: The characteristic infrared absorptions of the functional groups in the given molecule are to be predicted.
Concept introduction: An IR spectrum is a graph for the energy absorbed by a molecule as a function of the frequency or wavelength of light. Alkanes, alkenes and alkynes have characteristic
(i)
Answer to Problem 12.12SP
The characteristic infrared absorptions of the functional groups in the given molecule are,
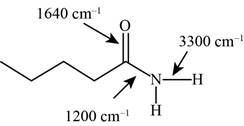
Figure 17
Explanation of Solution
The structure of the given molecule is,
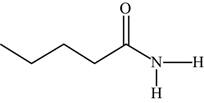
Figure 18
The possibilities of the IR stretching frequencies for the given molecule are shown as,
Figure 17
So, the stretching frequencies of
Want to see more full solutions like this?
Chapter 12 Solutions
Student's Solutions Manual for Organic Chemistry

- Which parameter between "solvent polarity function" and dielectric constant show better correlation with the peak positions? (cyclohexane, dioxane, acetonitrile, ethanol, ethylene glycol)arrow_forwardPoint out three most important absorptions, including frequency and molecular motion, to support the IR structure of 3,5-Dimethylbenzaldehyde. The focus is on determining the substitution pattern of the benzene ring and point out the functional groups present, with one of the absorptions coming from the fingerprint area of the spectrumarrow_forwardThe beer-lambert law is A = εlc, where A is the absorbance, ε is the molar extinction coefficient, l is the path lengh in cm and C is the concentration. The beer lambert law can be expressed in the form of y=mx + b, where A is y, and C is x.What is b and how is it used to calculate the final absorbance?arrow_forward
- The functional groups in an organic compound can frequently be deduced from its infrared absorption spectrum. A hydrocarbon exhibits no bands above 3000 but gives weak absorption at 2200 cm-1.Relative absorption intensity: (s)=strong, (m)=medium, (w)=weak. What functional class(es) does the compound belong to? List only classes for which evidence is given here. Attach no significance to evidence not cited explicitly.Do not over-interpret exact absorption band positions. None of your inferences should depend on small differences like 10 to 20 cm-1. The functional class(es) of this compound is(are)fill in the blank 1.(Enter letters from the table below, in any order, with no spaces or commas.) a. alkane (List only if no other functional class applies.) b. alkene h. amine c. terminal alkyne i. aldehyde or ketone d. internal alkyne j. carboxylic acid e. arene k. ester f. alcohol l. nitrile g. etherarrow_forwardPropose a structure consistent with each set of data. a.C9H10O2: IR absorption at 1718 cm−1b.C9H12: IR absorption at 2850–3150 cm−1arrow_forward2. A. Match the following IR spectra with their respective molecules butane, 1-butene, and 1- butyne. Explain your answer. B. Assigned the major peaks in spectra (indicate the positions of vibrational modes belonging to the major functional groups in molecules). C. Calculate the number of vibrational modes in butane.arrow_forward
- When compounds are prepared for IR analysis, they usually have to be dehydrated completely and then dissolved in a solvent other than water. Can you think of a reason why you might not want to have any H2O mixed in with your unknown compound when collecting its IR absorbance? Explain your rationale with respect to any observations about the spectra.arrow_forwardA common lab experiment is the dehydration of cyclohexanol to cyclohexene.(a) Explain how you could tell from the IR spectrum whether your product was pure cyclohexene, pure cyclohexanol,or a mixture of cyclohexene and cyclohexanol. Give approximate frequencies for distinctive peaks.arrow_forwardAbsorption bands in the region of 1600-1700 cm-1 are often used for quantification of caffeine. What does the bands in this region refer to?arrow_forward
- Convert the following infrared wavelengths to cm-1. 5.85 mm, typical for a ketone carbonylarrow_forward1. True or False a. UV-Vis spectroscopy normally reports data in the from of bands rather than single peaks because of overlapping electronic transitions that are being recorded by the detector. (T/F) b. When using linear regression to translate absorption data using Beer's Law, the y-intercept (+b) of the linear equation represents the path length. (T/F) c. Phosphorescent materials give a glowing effect because the electrons remain at an excited state for much longer, which is the cause for the "glow". (T/F)arrow_forwardFill in the table by matching the numbers of the structure to their corresponding peaks of the C-13 spectra.arrow_forward
 Macroscale and Microscale Organic ExperimentsChemistryISBN:9781305577190Author:Kenneth L. Williamson, Katherine M. MastersPublisher:Brooks Cole
 Organic Chemistry: A Guided InquiryChemistryISBN:9780618974122Author:Andrei StraumanisPublisher:Cengage Learning