
Concept explainers
Videos
To create:
A file that has two lines with n numbers in each and use subplot to show the barh and stacked bar charts side by side.
Answer to Problem 12.1P
Solution:
The script file is,
l = load('ponits.dat');
%load the points data file.
subplot(2, 1, 1)
%by using subplot show the bar graph and stacked bar graph side by side.
barh(l);
%plot the bar graph.
xlabel('Values');
%label the x axis as values.
ylabel('Groups');
%label the y axis as values.
subplot(2, 1, 2)
bar(l,'stacked');
%plot the stacked bar.
xlabel('Groups');
%label the x axis as groups.
ylabel('Values');
%label the y axis as values.
Explanation of Solution
Consider, the
MATLAB Code:
l = load('ponits.dat');
%load the points data file.
subplot(2, 1, 1)
%by using subplot show the bar graph and stacked bar graph side by side.
barh(l);
%plot the bar graph.
xlabel('Values');
%label the x axis as values.
ylabel('Groups');
%label the y axis as values.
subplot(2, 1, 2)
bar(l,'stacked');
%plot the stacked bar.
xlabel('Groups');
%label the x axis as groups.
ylabel('Values');
%label the y axis as values.
Save the MATLAB files with name, chapter12_54793_12_1P.m in the current folder. Execute the file by typing the name at the command window to generate output.
Result:
The plot is,
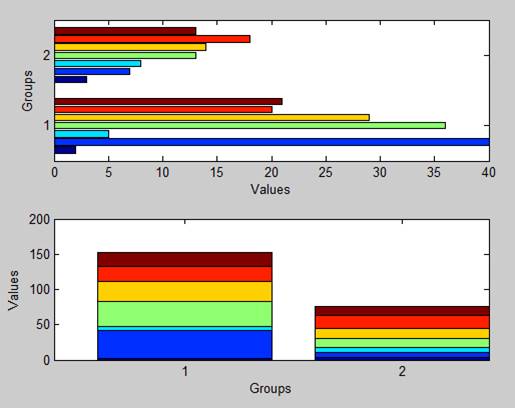
Therefore, the result is stated above.
Want to see more full solutions like this?
Chapter 12 Solutions
Matlab Fourth Edition: A Practical Introduction to Programming and Problem Solving


- Consider the matrix A=[2314]. Show that any of the three types of elementary row operations can be used to create a leading 1 at the top of the first column. Which do you prefer and why?arrow_forwardA factory manufactures three products (doohickies, gizmos, and widgets) and ships them to two warehouses for storage. The number of units of each product shipped to each warehouse is given by the matrix A=[20015010075100125] (where aij is the number of units of product i sent to warehouse j and the products are taken in alphabetical order). The cost of shipping one unit of each product by truck is $1.50 per doohickey, $1.00 per gizmo, and $2.00 per widget. The corresponding unit costs to ship by train are $1.75, $1.50, and $1.00. Organize these costs into a matrix B and then use matrix multiplication to show how the factory can compare the cost of shipping its products to each of the two warehouses by truck and by train.arrow_forwardPerform the needed row operation that will get the first entry in row 2 to be zero in the augmented matrix: [1136|22] .arrow_forward
 Algebra & Trigonometry with Analytic GeometryAlgebraISBN:9781133382119Author:SwokowskiPublisher:Cengage
 Linear Algebra: A Modern IntroductionAlgebraISBN:9781285463247Author:David PoolePublisher:Cengage Learning
 Algebra for College StudentsAlgebraISBN:9781285195780Author:Jerome E. Kaufmann, Karen L. SchwittersPublisher:Cengage Learning
 College AlgebraAlgebraISBN:9781305115545Author:James Stewart, Lothar Redlin, Saleem WatsonPublisher:Cengage Learning
 College Algebra (MindTap Course List)AlgebraISBN:9781305652231Author:R. David Gustafson, Jeff HughesPublisher:Cengage Learning