
a.
Construct the decision tree.
a.
Explanation of Solution
Here, there are two decision alternatives d1 and d2 and the three states of nature s1, s2 and s3.
Thus, the decision tree is given as follows:
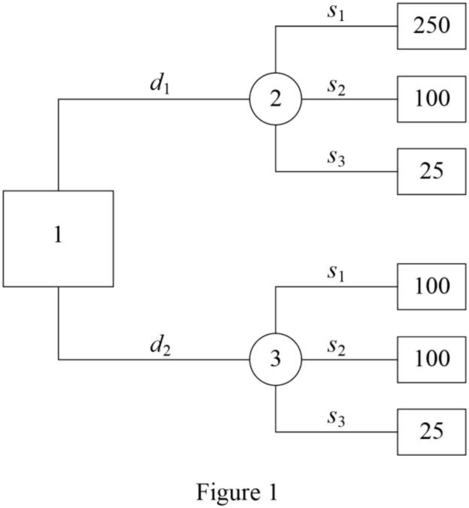
Thus, the decision tree has been constructed.
b.
Find the decision using the optimistic, conservative and minimax regret approaches.
b.
Answer to Problem 1P
The decision d1 gives the optimistic approach because it has the largest maximum profit.
The decision d2 gives the conservative approach because it has the largest minimum profit.
The minimax regret is the decision d1 because it minimizes the maximum regret.
Explanation of Solution
By using the decision tree in Part (a), the maximum and minimum profit based on the decisions d1 and d2.
| Decision | Maximum Profit | Minimum Profit |
| d1 | 250 | 25 |
| d2 | 100 | 75 |
Optimistic approach:
The optimistic approach evaluates each decision alternative in terms of best payoff that can occur.
The decision d1 gives the optimistic approach because it has the largest maximum profit (from the above table).
Conservative approach:
The conservative approach evaluates each decision alternative in terms of worst payoff that can occur.
The decision d2 gives the conservative approach because it has the largest minimum profit (from the above table).
Minimax Regret approach:
The minimax regret approach is the difference between the payoff associated with a particular alternative and payoff associated with the most decision that would yield the most desirable payoff for a given state of nature.
Regret or opportunity loss table:
|
Decision | s1 | s2 | s3 |
| d1 | 0 | 0 | 50 |
| d2 | 150 | 0 | 0 |
The maximum regret for the decision d1 is 50 and d2 is 150.
Here, the decision d1 has been selected because it minimizes the maximum regret.
Want to see more full solutions like this?
Chapter 12 Solutions
Essentials Of Business Analytics

- What is the pure strategy Nash equilibrium outcome if there is one Is this a socially optimal outcome? If not, which outcome is preferredarrow_forwardA group of medical professionals is considering constructing a private clinic. If a patient demand for the clinic is high, the physicians could realize a net profit of $120,000. If the demand is low, they could lose $55,000. Of course, they do not have to proceed at all, in which case there is no cost. In the absence of any market data, the best the physicians can guess is that there is a 50-50 chance the demand would be high. a) Create a decision tree. b) What should the medical professionals do? What is the payoff? c) The physicians have been approached by a market research firm that offers to perform a study of the market at a fee of $5,000. The market researchers claim that their experience enables them to use Bayes’ theorem to make the following statements of probability: -probability of high demand given a positive survey result = 0.82 -probability of low demand given a positive survey result = 0.18 -probability of high demand given a negative survey result = 0.11 -probability of…arrow_forwardAn article in a 2006 issue of Journal of Behavioral Decision Making reported on a study involving 47 undergraduate students in a class at Harvard. All of the participants were given $50, but some (randomly assigned) were told that this was a "tuition rebate", while the others were told that this was "bonus income". After one week, the students were contacted again and asked how much of the $50 they had spent and how much they had saved. Those in the "rebate" group had spent an average of $22.04 while those in the "bonus" group had spent an average of $9.55." (a) Did this study make use of random sampling, random assignment, both, or neither? Explain. (b) If the difference in average spending amounts between the two groups is determined to be statistically significant, would it be appropriate to draw a cause-and-effect conclusion in this case? Explain. (c) If the difference in average spending amounts between the two groups is determined to be statistically significant, would it be…arrow_forward
- The Titanic data set contains information, whether passengers of the Titanic survived the shipwreck, based on their gender, age and passenger class. The following decision tree has been learned on this data. Which of the statements are true? a) Overall, 62% of the passengers in the data set died. b) A ‘new‘ passenger (female, 3rd class, 30 years old) is predicted to die in the shipwreck. c) 62% of the passengers in the data set are female. d) All male 3rd class passengers in the data set died.arrow_forwardResearchers Kaitlin Woolley and Ayelet Fishbach (2019) told participants that they were participating in a study on the effects of Hunger. Pairs of participants were told to eat a snack of salsa and chips with a stranger, after which they engaged in a negotiation task. After which, they engaged in a negotation task. Half of the participant-pairs were randomly assigned to share a plate of salsa and chips, and the other half of participant-pairs were randomly assigned to eat their own individual servings. More specifically, the researchers reported that "participants were run in pairs of strangers. We preregistered the study and collected data from 200 undergraduate and graduate students outside a campus cafe (107 female; M=23.57 years, SD=8.80)" What did the researchers mean when they said they "preregistered the study"? a. They registered the study on a website so that students could signup to participate b. They recorded their research design and analysis plan before conducting the…arrow_forwardProblem 3: A group of doctors is considering the construction of a private clinic. IF the medical demand is high (favorable market for the clinic), the physicians could realize a profit of P1,000,000. If the market is not favorable they could lose P400,000. If they don’t proceed at all, there is no cost. In the absence of any market research, the best the physician can guess is that there is a 50-50 chance the clinic will be successful. Required: Construct a decision tree to help analyze this problem. What should the doctors do?arrow_forward
- The National Highway Association is studying the relationship between the number of bidders on a highway project and the winning (lowest) bid for the project. Of particular interest is whether the number of bidders increases or decreases the amount of the winning bid. Bidders Price 9.0 5.1 9.0 8.0 3.0 9.7 10.0 7.8 5.0 7.7 10.0 5.5 7.0 8.3 11.0 5.5 6.0 10.3 6.0 8.0 4.0 8.8 7.0 9.4 7.0 8.6 7.0 8.1 6.0 7.8 Given: Correlation of Coefficient: 0.7064 (This is correct) Coefficient of determination: 49.90% (This is correct) ŷ = 11.2360 + (-0.4667)x (This is correct) Create a scatter plot of the data Complete a regression analysis of the relationship. Slope = ______ Estimate the winning bid if there were seven bidders. Winning bid cost ______ millions. Compute the 95% prediction interval for a winning bid if there are seven bidders. [ _____________, ______________]arrow_forwardThe National Highway Association is studying the relationship between the number of bidders on a highway project and the winning (lowest) bid for the project. Of particular interest is whether the number of bidders increases or decreases the amount of the winning bid. Bidders Price 9.0 5.1 9.0 8.0 3.0 9.7 10.0 7.8 5.0 7.7 10.0 5.5 7.0 8.3 11.0 5.5 6.0 10.3 6.0 8.0 4.0 8.8 7.0 9.4 7.0 8.6 7.0 8.1 6.0 7.8 GIVEN: correlation coefficient: - 0.7064 Slope: -0.4667 Coefficient of determination: 49.90% regression equation: ŷ= 11.2360 + (-4467)x FIND: Estimate the winning bid if there were seven bidders. Winning bid cost _________ millions. Explain. Compute the 95% prediction interval for a winning bid if there are seven bidders. [ _______________ , _______________ ] (Explain).arrow_forwardIn a study of the domestic market share of the three major automobile manufacturers A, B, and C in a certain country, it was found that their current market shares were 65%, 10%, and 25%, respectively. Furthermore, it was found that of the customers who bought a car manufactured by A, 75% would again buy a car manufactured by A, 15% would buy a car manufactured by B, and 10% would buy a car manufactured by C. Of the customers who bought a car manufactured by B, 90% would again buy a car manufactured by B, whereas 5% each would buy cars manufactured by A and C. Finally, of the customers who bought a car manufactured by C, 85% would again buy a car manufactured by C, 5% would buy a car manufactured by A, and 10% would buy a car manufactured by B. Assuming that these sentiments reflect the buying habits of customers in the future, determine the market share that will be held by each manufacturer after the next two model years. (Round your answers to the nearest percent.)arrow_forward
- In an online psychology experiment sponsored by the University of Mississippi, researchers asked study participants to respond to various stimuli. Participants were randomly assigned to one of three treatment groups: Group 1, the simple group, required to respond as quickly as possible after a stimulus was presented; Group 2, the go/no-go group, required to respond to a particular stimulus while disregarding other stimuli; and Group 3, the choice group, required to respond differently depending on the stimuli presented. The researcher felt that age may be a factor in determining reaction time, so she organized the experimental units by age into an 18-24 year old group (1), a 25-34 year old group (2), and a 35 and older group (3). She obtained the data given in the “Psychology data” JMP file. a)How many treatments are there? b)What type of factorial design is this? How many replications are there within each cell?arrow_forwardOne of the issues that usually come up in the US presidential elections is how to deal with a sluggish economy. Specifically, should the government cut spending, raise taxes, inflate the economy by printing more money, or do none of the above and let the deficit rise? And as with most other issues, politicians need to know which parts of the electorate support these options. Suppose that a random sample of 1,000 people was asked which option they support and their political affiliations. The possible responses to the question about the preferred economic option were the four options mentioned above (i.e., Cut, Raise, Inflate, and Let), and to the question about political affiliation the respondents could answer Democrat, Republican, or Independent (which included a variety of political persuasions). The responses are summarised in the table below. Do these data allow us to conclude at the 1% significance level that political affiliation affects support for the economic options?…arrow_forwardIn a study of the domestic market share of the three major automobile manufacturers A, B, and C in a certain country, it was found that their current market shares were 45%, 20%, and 35%, respectively. Furthermore, it was found that of the customers who bought a car manufactured by A, 75% would again buy a car manufactured by A, 15% would buy a car manufactured by B, and 10% would buy a car manufactured by C. Of the customers who bought a car manufactured by B, 90% would again buy a car manufactured by B, whereas 5% each would buy cars manufactured by A and C. Finally, of the customers who bought a car manufactured by C, 85% would again buy a car manufactured by C, 5% would buy a car manufactured by A, and 10% would buy a car manufactured by B. Assuming that these sentiments reflect the buying habits of customers in the future, determine the market share that will be held by each manufacturer after the next two model years. (Round your answers to the nearest percent.) A % B…arrow_forward
 MATLAB: An Introduction with ApplicationsStatisticsISBN:9781119256830Author:Amos GilatPublisher:John Wiley & Sons Inc
 Probability and Statistics for Engineering and th...StatisticsISBN:9781305251809Author:Jay L. DevorePublisher:Cengage Learning
 Statistics for The Behavioral Sciences (MindTap C...StatisticsISBN:9781305504912Author:Frederick J Gravetter, Larry B. WallnauPublisher:Cengage Learning
 Elementary Statistics: Picturing the World (7th E...StatisticsISBN:9780134683416Author:Ron Larson, Betsy FarberPublisher:PEARSON
 The Basic Practice of StatisticsStatisticsISBN:9781319042578Author:David S. Moore, William I. Notz, Michael A. FlignerPublisher:W. H. Freeman
 Introduction to the Practice of StatisticsStatisticsISBN:9781319013387Author:David S. Moore, George P. McCabe, Bruce A. CraigPublisher:W. H. Freeman