
Videos
INTEGRATED CASE
ALLIED FOOD PRODUCTS
CAPITAL BUDGETING AND CASH FLOW ESTIMATION Allied Food Products is considering expanding into the fruit juice business with a new fresh lemon juice product. Assume that you were recently hired as assistant to the director of capital budgeting, and you must evaluate the new project.
The lemon juice would be produced in an unused building adjacent to Allied's Fort Myers plant; Allied owns the building, which is fully
The project is expected to operate for 4 years, at which time it will be terminated. The
Unit sales are expected to total 100,000 units per year, and the expected sales price is $2.00 per unit. Cash operating costs for the project (total operating costs less depreciation) are expected to total 60% of dollar sales. Allied's tax rate is 40%, and its WACC is 10%. Tentatively, the lemon juice project is assumed to be of equal risk to Allied's other assets.
You have been asked to evaluate the project and to make a recommendation as to whether it should be accepted or rejected. To guide you in your analysis, your boss gave you the following set of tasks/ questions:
- a. Allied has a standard form that is used in the capital budgeting process. (See Table IC 12.1.) Part of the table has been completed, but you must replace the blanks with the missing numbers. Complete the table using the following steps:
- 1. Fill in the blanks under Year 0 for the initial investment outlays: CAPEX and ΔNOWC.
- 2. Complete the table for unit sales, sales price, total revenues, and operating costs excluding depreciation.
- 3. Complete the depreciation data.
- 4. Complete the table down to after-tax operating income and then down to the project's operating cash flows, EBIT(1 − T) + DEP.
- 5. Fill in the blanks under Year 4 for the terminal cash flows and complete the project
free cash flow line. Discuss the recovery of net operating working capital. What would have happened if the machinery had been sold for less than its book value?
- b. 1. Allied uses debt in its capital structure, so some of the money used to finance the project will be debt. Given this fact, should the projected cash flows be revised to show projected interest charges? Explain.
2. Suppose you learned that Allied had spent $50,000 to renovate the building last year, expensing these costs. Should this cost be reflected in the analysis? Explain.
3. Suppose you learned that Allied could lease its building to another party and earn $25,000 per year. Should that fact be reflected in the analysis? If so, how?
4. Assume that the lemon juice project would take profitable sales away from Allied's fresh orange juice business. Should that fact be reflected in your analysis? If so, how?
- c. Disregard all the assumptions made in part b and assume there is no alternative use for the building over the next 4 years. Now calculate the project's
NPV ,IRR , MIRR, and payback. Do these indicators suggest that the project should be accepted? Explain.
Allied's Lemon Juice Project (in Thousands) TABLE IC 12.1
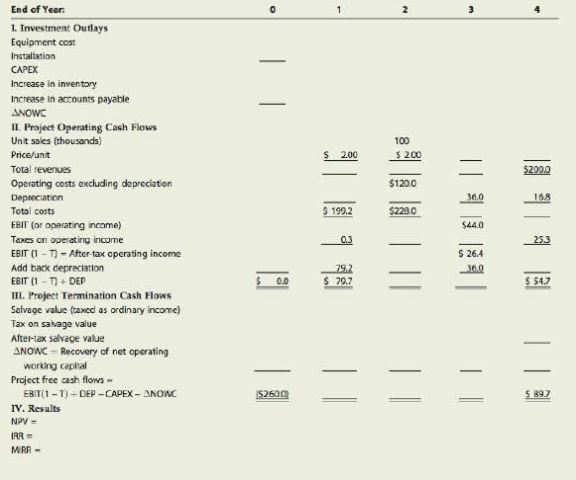
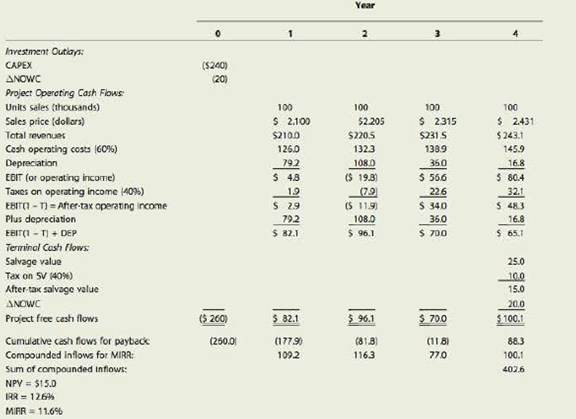
TABLE IC 12.2 Allied's Lemon Juice Project Considering 5% Inflation (in Thousands)
- d. If this project had been a replacement rather than an expansion project, how would the analysis have changed? Think about the changes that would have to occur in the cash flow table.
- e. 1. What three levels, or types, of project risk are normally considered?
2. Which type is most relevant?
3. Which type is easiest to measure?
4. Are the three types of risk generally highly correlated?
- f. 1. What is sensitivity analysis?
2. How would you perform a sensitivity analysis on the unit sales, salvage value, and WACC for the project? Assume that each of these variables deviates from its base-case, or expected, value by plus or minus 10%, 20%, and 30%. Explain how you would calculate the NPV, IRR, MIRR, and payback for each ease; but don't do the analysis unless your instructor asks you to.
3. What is the primary weakness of sensitivity analysis? What are its primary advantages?
Work out quantitative answers to the remaining questions only if your instructor asks you to. Also note that it will take a long time to do the calculations unless you are using an Excel model.
- g. Assume that inflation is expected to average 5% over the next 4 years and that this expectation is reflected in the WACC. Moreover, inflation is expected to increase revenues and variable costs by this same 5%. Does it appear that inflation has been dealt with properly in the initial analysis to this point? If not, what should be done and how would the required adjustment affect the decision?
- h. The expected cash flows, considering inflation (in thousands of dollars), are given in Table IC 12.2. Allied's WACC is 10%. Assume that you are confident about the estimates of all the variables that affect the cash flows except unit sales. If product acceptance is poor, sales would be only 75,000 units a year, while a strong consumer response would produce sales of 125,000 units. In either case, cash costs would still amount to 60% of revenues. You believe that there is a 25% chance of poor acceptance, a 25% chance of excellent acceptance, and a 50% chance of average acceptance (the base case). Provide numbers only if you are using a computer model.
- 1. What is the worst-case NPV? The best-case NPV?
- 2. Use the worst-case, most likely case (or base-case), and best-case NPVs with their probabilities of occurrence, to find the project's expected NPV, standard deviation, and coefficient of variation.
- i. Assume that Allied's average project has a coefficient of variation (CV) in the range of 1.25 to 1.75. Would the lemon juice project be classified as high risk, average risk, or low risk? What type of risk is being measured here?
- j. Based on common sense, how highly correlated do you think the project would be with the firm's other assets? (Give a correlation coefficient or range of coefficients, based on your judgment.)
- k. How would the correlation coefficient and the previously calculated σ combine to affect the project's contribution to corporate, or within-firm, risk? Explain.
- l. Based on your judgment, what do you think the project's correlation coefficient would be with respect to the general economy and thus with returns on “the market”? How would correlation with the economy affect the project's market risk?
- m. Allied typically adds or subtracts 3% to its WACC to adjust for risk. After adjusting for risk, should the lemon juice project be accepted? Should any subjective risk factors be considered before the final decision is made? Explain.
- n. In recent months, Allied’s group has begun to focus on real option analysis.
- 1. What is real option analysis?
- 2. What are some examples of projects with embedded real options?
a.1.
To determine: The initial investment outlays for Capital expenditure (CAPEX) and change in Net operating working capital (ΔNOWC).
Introduction:
Cash Flows:
Cash flows refer to the values which are being used in and out of the business, and that affects the liquidity of the company.
Explanation of Solution
Calculation of the initial investment outlay for Capital expenditure
| Year | Particulars |
Amount ($) |
| 0 | Equipment cost | 200,000 |
| 0 | Shipping and Installment cost | 40,000 |
| 240,000 |
Table (1)
The initial investment outlay for Capital expenditure is $240,000.
Calculation of the initial investment outlay for change in the Net operating working capital:
| Year | Particulars |
Amount ($) |
| 0 | Inventories | 25,000 |
| 0 | Accounts payable | (5,000) |
| 20,000 |
Table (2)
The initial investment outlay for change in the Net operating working capital is $20,000.
Hence, the initial investment outlay for Capital expenditure (CAPEX) is $240,000 and for change in Net operating working capital (ΔNOWC) is $20,000.
2.
To determine: The value to be filled in the table for unit sales, sales price, total revenues and operating costs excluding depreciation.
Explanation of Solution
The values to be filled in the table are as follows:
| End of year | 0 | 1 | 2 | 3 | 4 | |
| Investment outlays at time=0 | ||||||
| 1. | Capital expenditure | (240,000) | ||||
| 2. | Net operating working capital | (20,000) | ||||
| Operating cash flows over the projects | ||||||
| 3. | Unit sales (in units) | - | 100,000 | 100,000 | 100,000 | 100,000 |
| 4. | Sale price | - | 2.00 | 2.00 | 2.00 | 2.00 |
| 5. |
Revenue on sales
| - | 200,000 | 200,000 | 200,000 | 200,000 |
| 6. |
Operating costs excluding depreciation (60% of sales) | 120,000 | 120,000 | 120,000 | 120,000 |
Table (3)
Units sold from the year 1 to year 4 is 100,000 units per year, the selling price per unit of unit sold is $2 per unit from the year 1 to year 4, the revenue from sales from year 1 to year 4 is $200,000, and the operating costs excluding depreciation is $120,000 form year 1 to year 4.
3.
To determine: The data to be filled in for depreciation.
Explanation of Solution
The data for depreciation in the table is as:
| End of year | 0 | 1 | 2 | 3 | 4 | |
| Investment outlays at time=0 | ||||||
| 1. | Capital expenditure | (240,000) | ||||
| 2. | Net operating working capital | (20,000) | ||||
| Operating cash flows over the projects | ||||||
| 3. | Unit sales (in units) | - | 100,000 | 100,000 | 100,000 | 100,000 |
| 4. | Sale price | - | 2.00 | 2.00 | 2.00 | 2.00 |
| 5. |
Revenue on sales
| - | 200,000 | 200,000 | 200,000 | 200,000 |
| 6. | Operating cost excluding depreciation @ 60% of sales | - | 120,000 | 120,000 | 120,000 | 120,000 |
| 7. | Depreciation | - | 79,200 | 108,000 | 36,000 | 16,800 |
Table (4)
Working notes:
Calculation of the value of the depreciation:
| Year | Value of asset |
Depreciation (%) |
Depreciation ($) |
Written down value ($) |
| 1 | 240,000 | 33% | 79,200 | 160,800 |
| 2 | 240,000 | 45% | 108,000 | 52,800 |
| 3 | 240,000 | 15% | 36,000 | 16,800 |
| 4 | 240,000 | 7% | 16,800 | - |
Table (5)
The depreciation charged in the year 1 is $79,200, the depreciation charged in the year 2 is $108,000, depreciation charged in the year 3 is $36,000 and the depreciation charged in the year 4 is $16,800.
4.
To determine: The values to be filled in the table for after-tax operating income and for project’s operating cash flows.
Explanation of Solution
The values to be filled are as follows:
| End of year | 0 | 1 | 2 | 3 | 4 | |
| Investment outlays at time=0 | ||||||
| 1. | Capital expenditure | (240,000) | ||||
| 2. | Net operating working capital | (20,000) | ||||
| Operating cash flows over the projects | ||||||
| 3. | Unit sales (in units) | - | 100,000 | 100,000 | 100,000 | 100,000 |
| 4. | Sale price | - | 2.00 | 2.00 | 2.00 | 2.00 |
| 5. |
Revenue on sales
| - | 200,000 | 200,000 | 200,000 | 200,000 |
| 6. | Operating cost excluding depreciation @ 60% of sales | - | 120,000 | 120,000 | 120,000 | 120,000 |
| 7. | Depreciation | - | 79,200 | 108,000 | 36,000 | 16,800 |
| 8. | Total operating costs (6+7) | - | 199,200 | 228,000 | 156,000 | 136,800 |
| 9. | Earnings before interest and tax (EBIT)
| - | 800 | (28,000) | 44,000 | 63,200 |
| 10. | Less: Tax @40% of EBIT | - | 320 | (16,800) | 17,600 | 25,280 |
| 11. | Earnings after tax (9-10) | - | 480 | (16,800) | 26,400 | 37,920 |
| 12. | Add: Depreciation | - | 79,200 | 108,000 | 36,000 | 16,800 |
Table (6)
Hence, the values to be filled in the table are as above.
5.
To determine: The values to be filled in the table for cash flows and explain the recovery of net operating working capital and the situation if the machinery had been sold for less than the book value.
Explanation of Solution
The values to be filled in the table are as follows:
| End of year | 0 | 1 | 2 | 3 | 4 | |
| Investment outlays at time=0 | ||||||
| 1. | Capital outlay | (240,000) | ||||
| 2. | Net operating working capital | (20,000) | ||||
| Operating cash flows over the projects | ||||||
| 3. | Unit sales (in units) | - | 100,000 | 100,000 | 100,000 | 100,000 |
| 4. | Sale price | - | 2.00 | 2.00 | 2.00 | 2.00 |
| 5. |
Revenue on sales
| - | 200,000 | 200,000 | 200,000 | 200,000 |
| 6. | Variable cost @ 60% of sales | - | 120,000 | 120,000 | 120,000 | 120,000 |
| 7. | Depreciation | - | 79,200 | 108,000 | 36,000 | 16,800 |
| 8. | Total operating costs (6+7) | - | 199,200 | 228,000 | 156,000 | 136,800 |
| 9. | Earnings before interest and tax | - | 800 | (28,000) | 44,000 | 63,200 |
| 10. | Less: Tax @40% | - | 320 | (11,200) | 17,600 | 25,280 |
| 11. | Earnings after tax (9-10) | - | 480 | (16,800) | 26,400 | 37,920 |
| 12. | Add: Depreciation | - | 79,200 | 108,000 | 36,000 | 16,800 |
| 13. | Add: Salvage value after taxes | - | - | - | - | 15,000 |
| 14. | Add: Recapture of working capital | - | - | - | - | 20,000 |
| 15. |
Cash flows (11+12+13+14+1+2) | (260,000) | 79,680 | 91,200 | 62,400 | 89,720 |
Table (7)
Working note:
Calculation of the salvage value after tax:
| Particulars |
Amount ($) |
| Salvage value | 25,000 |
| Less: Tax @40% | 10,000 |
| Salvage value after tax | 15,000 |
Table (8)
If the machinery has been sold the value less than the book value of machinery than the company will generate loss from the selling the machinery
Thus, the values filled in the table are as above and the net working capital to be recovered is the salvage value of the machine.
b.1.
To explain: The projected cash flows should be revised or not to show the projected interest charges.
Answer to Problem 20IC
The projected cash flows need not be revised to show the projected interest charges as the cost of debt is used to discount the cash flows.
Explanation of Solution
- The cash flows refer to that amount which is transferred to the business and is sent out of the business.
- The cost of debt is that amount which is shown in percentage as the interest which is paid on the borrowings.
- The projected cash flows are not needed to be revised to show the interest charges which are projected.
Hence, the projected cash flows are not needed to be revised to show the projected interest charges.
2.
To explain: The way in which the cost of renovation will be reflected in the analysis.
Answer to Problem 20IC
- The amount which is spent in the renovation of the building is a sunk cost.
- As the amount is spent in the last year, it is not relevant for the current project or for the decision to be made in the project.
Explanation of Solution
- The sunk cost refers to the cost which has already incurred and that it cannot be recovered.
- The amount which is spent in the renovation of a building is that cost which has incurred and hence it is not relevant for the current project.
Hence, the cost of renovation will be treated as a sunk cost in the cost analysis.
3.
To explain: The way in which the cost of the lease will be reflected in the cost analysis.
Answer to Problem 20IC
- The cost of the lease is an opportunity cost for the company.
- On the expansion of the company, the company has foregone the revenue from the rent of building and so this cost is relevant to the decision making.
- The amount of this cost is $25,000 less tax@40% which is $15,000.
Explanation of Solution
- The cost of lease refers to that amount which is paid for a given period of time for the rent of an asset.
- This is an opportunity cost for the company.
- So, this cost is important in the decision making.
Hence, the cost of the lease is reflected as an opportunity cost in the cost analysis.
4.
To explain: The way in which the profitable sales will be taken away by one company from another.
Answer to Problem 20IC
In the cost analysis of the company:
- The profitable sale which is taken away by the lemon juice project from the orange juice project should be shown.
- The increased amount of lemon juice project will be reduced in that project and that will be shown as the income amount in the orange juice project.
Explanation of Solution
- The profitable sale refers to that sale in which a company has gained an amount of profit on the sale.
- If this amount of profit is taken by a company from another company, this needs to be shown in the analysis of the cost.
- The increased amount of profit which a company gets from another company should be shown as the income of that company.
Hence, the profitable sale amount should be shown in the cost analysis.
c.
To determine: The project’s NPV, IRR, MIRR and payback and whether the indicators suggest that the project should be accepted.
Explanation of Solution
Calculation of the net present value:
| Year | Cash flows | Present value factor @10% | Present value of cash flow |
| 0 | (260,000) | 1.0000 | (260,000) |
| 1 | 79,680 | 0.9091 | 72,437 |
| 2 | 91,200 | 0.8264 | 75,368 |
| 3 | 62,400 | 0.7513 | 46,881 |
| 4 | 89,720 | 0.6830 | 61,278 |
| Net present value | (4,036) | ||
Table (9)
The net present value is ($4,036). As the net present value is negative, so the project is not viable.
Calculation of the internal rate of return:
Given,
Present value @ 9% is $1,604 (Working notes)
Present value @10% is ($4,036).
The discounted rate 1 is 9% (R1).
The discounted rate 2 is 10% (R2).
The formula to calculate the internal rate of return is,
Substitute 9% for rate, $1,604 for the present value at 9% and $4,036 for the present value at 10% (refer working note) in the above formula.
The internal rate of return is 9.28%.
Calculation of the modified rate of return:
The formula to calculate the modified rate of return is,
Where,
- MIRR is the modified rate of return.
- FV is the future value.
- PV is the present value.
- n is the time period.
Substitute $374,766 for the future value, $260,000 for the present value and 4 for the time period in the above formula.
The modified rate of return is 9.57%. As the MIRR is less than the cost of capital so, this project is not viable.
Calculation of the payback period:
The formula to calculate the payback period is,
Substitute 3 for the time period, $260,000 at the present value in a current year, $233,280 at 3rd year and $323,000 for the present value at the 4th year in the above formula.
The payback period is 3.29 years.
Working note:
Calculation of the present value of cash flow at 9%:
| Year | Cash flows | Present value factor @10% | Present value of cash flow | Present value factor @9% | Present value of cash flow |
| 0 | (260,000) | 1.0000 | (260,000) | 1.0000 | (260,000) |
| 1 | 79,680 | 0.9091 | 72,437 | 0.9174 | 73,098 |
| 2 | 91,200 | 0.8264 | 75,368 | 0.8417 | 76,763 |
| 3 | 62,400 | 0.7513 | 46,881 | 0.7722 | 48,185 |
| 4 | 89,720 | 0.6830 | 61,278 | 0.7084 | 63,558 |
| Net present value | (4,036) | 1,604 | |||
Table (10)
Calculation of the future value of positive cash flows:
| Year | Cash flows | Future value factor @10% | Future value of cash flow |
| 1 | 79,680 | 1.3310 | 106,054 |
| 2 | 91,200 | 1.2100 | 110,352 |
| 3 | 62,400 | 1.1000 | 68,640 |
| 4 | 89,720 | 1.0000 | 89,720 |
| Future value | 374,766 | ||
Table (11)
Calculation of the present value of the negative cash flows:
| Year | Cash flows | Present value factor @10% | Present value of cash flow |
| 0 | (260,000) | 1.0000 | (260,000) |
| Present value | (260,000) | ||
Table (12)
Calculation of the cumulative cash flows:
| Year | Cash flows | Cumulative cash flow |
| 1 | 79,680 | 79,680 |
| 2 | 91,200 | 170,800 |
| 3 | 62,400 | 233,280 |
| 4 | 89,720 | 323,000 |
Table (13)
Thus, the net present value is ($4,030), the internal rate of return is 9.28%, the modified rate of return is 9.57% and the payback period is 3.29 years.
d.
To explain: The changes that have been if this is a replacement rather than an expansion project and the changes that have been in the cash flow table.
Explanation of Solution
The following changes have been if it had been a replacement rather than an expansion:
- The difference in the cash flows between the existed project and the new project should be determined.
- If the result net income is a positive value then the new project is viable and if the net income is negative then the new project is not viable.
- The cash flow table consists of the cash flows of the existed project, cash flows of a new project and the increased cash flows.
- From the increased cash flows, the net present value, the modified rate of return and the payback period are determined.
- The cash flow table is that table which shows all the cash inflows and the cash outflows.
- The cash flow table shows the cash flows of the current project, the cash flows of the future project and the increase in the cash flows.
- The value of the cash flows table changes when the changes are made.
Thus, above-mentioned changes are made if that is a replacement project rather than an expansion project.
e.1.
To determine: The three levels or types of project risks.
Answer to Problem 20IC
The three levels or types of project risk are as follows:
- Stand-alone risk.
- Corporate risk.
- Market risk.
Explanation of Solution
There are many risks attached to a project. These are as follows:
- Stand-alone risk: This is the total risk of the project if the project is operated independently. The stand-alone risk is measured by the standard deviation or the coefficient of variation of the net present value.
- Corporate risk: This risk refers to the total riskiness of the project as with the diversification of the firm. This risk is that which is found within a firm. This is measured by the beta of the project.
- Market risk: This risk refers to the riskiness of the project which is to a well-diversified investor. This includes both the corporate risk and the stockholder diversification.
Thus, the three levels of risks which are attached to the project are as follows.
2.
To determine: The most relevant type of risk.
Answer to Problem 20IC
The most relevant type of risk for projects related to market is a market risk.
Explanation of Solution
- As the primary goal of management is the maximization of the wealth of the shareholder, the market risk is the most relevant risk.
- The creditors, customers, suppliers, and employees all are affected by the total risk of the firm.
- As these parties influence the profitability of the firm, the risk which is in the firm should not be ignored completely.
Thus, the most relevant risk is the market risk.
3.
To determine: The type of risk which is easiest to measure.
Answer to Problem 20IC
The stand-alone risk is the easiest risk to measure.
Explanation of Solution
- The stand-alone risk is that risk which is easiest to measure.
- The firm focuses on this risk while making the capital budgeting decisions.
- This focus on risk is not wholly correct but it does not lead to poor decisions.
- The projects of a firm are of its core business, so the firm focuses on the stand-alone risk.
Thus, the easiest risk to measure is a stand-alone risk.
4.
To determine: Whether the three types of risks are highly correlated or not.
Answer to Problem 20IC
The stand-alone risk is expected to be highly correlated with the corporate risk and the corporate risk is expected to be highly correlated with the market risk.
Explanation of Solution
- The projects which a firm undertakes are generally related to the core business of it.
- So, the stand-alone risk is correlated with the risk which is present within the firm.
- And the corporate risk is correlated with the risks which are present in the market.
Thus, the three types of risks are highly correlated to one another.
f.1.
To explain: The sensitivity analysis.
Explanation of Solution
- The sensitivity analysis is a measure to record the effect of changes in a particular variable, like revenues on a net present value of a project.
- In a sensitivity analysis, all the variables are fixed at their expected values only except one.
- The one variable is changed by some percentage, and the resulting effect on the net present value is noted.
- The sensitivity analysis is an analysis which is used to determine the different values of an independent variable which effects a particular dependent variable in a given set of assumptions.
- It is an assumption method in which a graph is plotted showing the changes in values of an independent variable on a dependent variable.
Thus, the sensitivity analysis is a financial measure.
2.
To explain: The sensitivity analysis performed on the unit sales, salvage value and WACC for the project and the calculation of the NPV, IRR, MIRR, and payback for the case.
Explanation of Solution
The following sensitivity analysis should be performed:
- The base case value for unit sales was 100. Assume that this value deviated by plus and minus 10%, 20% and 30%, the unit sales values to be used in the sensitivity analysis would be 70, 80, 90, 110, 120 and 130 units.
- Now any of the unit value like 70 units can be taken and the different values for change in sales units is determined for the cash values for the project.
- When the net cash flows are calculated, then the NPV, IRR, MIRR, and payback is calculated.
- Then repeat the same procedure for the sensitivity analysis on the salvage value and on the cost of capital.
- The sensitivity analysis is generally done by using excel.
- A spreadsheet is made and then values are put into it and results are analyzed.
The sensitivity analysis graph for the given data is:
| Change from the base level | Resulting NPV after the indicated change in: | ||
| Unit sales | Salvage value | WACC | |
| -30% | ($36.4) | $11.9 | $34.1 |
| -20% | ($19.3) | 12.9 | 27.5 |
| -10% | ($2.1) | 13.9 | 21.1 |
| 0 | 15.0 | 15.0 | 15.0 |
| +10% | 32.1 | 16.0 | 9.0 |
| +20% | 49.2 | 17.0 | 3.3 |
| +30% | 66.3 | 18.0 | (2.2) |
Table (14)
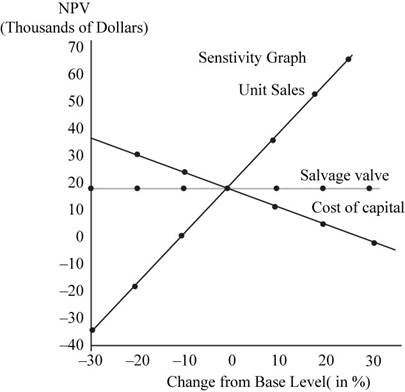
This graph is generated by using a spreadsheet.
- The sensitivity analysis intersects at 0% change and the base case NPV at approx. $15,000.
- In this case, as the all other variables are set to their expected values this is a zero change situation.
- The plots for the unit sales and the salvage value are upward sloping, which indicates that the higher variable values lead to higher NPVs.
- The plots for the unit sales are much steeper than that for the salvage value. This shows that the NPV is more sensitive to changes in unit sales than to changes in the salvage value.
- The steeper sensitivity lines are an indication of a greater risk.
- So, when the graph of two projects is compared, the one line with the steeper line is riskier.
Thus, the sensitivity analysis is performed in an above-mentioned manner.
3.
To explain: The primary weakness of the sensitivity analysis and the primary advantages of it.
Answer to Problem 20IC
The primary weaknesses of the sensitivity analysis are as follows:
- There is no reflection ofthe effects of diversification.
- Sensitivity analysis does not include any information about the potential magnitudes of the forecast errors.
- The analysis can indicate that a project’s NPV is highly sensitive to the forecast of the sales, so the project is risky but if the project is fixed by a long-term contract, then sales variations may actually contribute little to the risk of the project.
The primary advantage of the sensitivity analysis is as follows:
- It does identify those variables that have the greatest impact on the profitability.
- It helps themanagement to focus the attention on those variables that are the most important.
Explanation of Solution
- The sensitivity analysis is an analysis which is used to determine the different values of an independent variable which effects a particular dependent variable in a given set of assumptions.
- It is an assumption method in which a graph is plotted showing the changes in values of an independent variable on a dependent variable.
Thus, the primary weaknesses and the advantages of the sensitivity analysis are as mentioned above.
g.
To explain: The dealing of inflation in the initial analysis and the steps to be done that would affect the required adjustment.
Explanation of Solution
The inflation is dealt in the following manner:
- The data in the tables show that the inflation is not reflected in the calculations.
- The sales price is held constant and it does not rise with the inflation. So, the revenues and costs should be increased by 5% every year.
- As the revenues are larger than the operating costs, the inflation will cause the cash flows to increase.
- This results in a higher NPV, IRR and MIRR and a shorter payback period.
The table of the project showing 5% inflation is:
|
Inputs: Price: $2.00 VC rate: 60.0%
|
WACC: T-rate: |
10% 40%
|
Inflation: 5.0%
| |||
| End of year: | 0 | 1 | 2 | 3 | 4 | |
| I. | Investment outlay: | |||||
| Equipment cost | ($200) | |||||
| Installation | ($40) | |||||
| Increase in inventory | ($25) | |||||
| Increase in accounts payable | $5 | |||||
| Total net investment | ($260) | |||||
| II. | Operating cash flows: | |||||
| Unit sales (thousands) | 100 | 100 | 100 | 100 | ||
| Price/unit | $2.10 | $2.205 | $2.315 | $2.431 | ||
| Total revenues | $210.0 | $220.5 | $231.5 | $243.1 | ||
| Operating costs excluding depreciation | $126.0 | $132.3 | $138.9 | $145.9 | ||
| Depreciation | $79.2 | $108.0 | $36.0 | $16.8 | ||
| Total costs | $205.2 | $240.3 | $174.9 | $162.7 | ||
| Operating income before taxes | $1.9 | ($7.9) | $22.6 | $32.1 | ||
| After-tax operating income | $2.9 | ($11.9) | $34.0 | $48.3 | ||
| Add: Depreciation | $79.2 | $108.0 | $36.0 | $16.8 | ||
| Operating cash flows | $82.1 | $96.1 | $70.0 | $65.1 | ||
| III. | Terminal year cash flows: | |||||
| Salvage value | 25.0 | |||||
| Tax on salvage | 10.0 | |||||
| After-tax salvage value | 15.0 | |||||
| Net operating working capital | 20.0 | |||||
| IV. | Project free cash flows | ($260) | $82.1 | $96.1 | $70.0 | $100.1 |
| Cumulative cash flow for payback | ($260) | ($177.9) | ($81.8) | ($11.8) | 88.3 | |
| Compounded inflows for MIRR: | 109.2 | 116.3 | 77.0 | 100.1 | ||
| Sum of compounded inflows: | 402.6 | |||||
|
NPV=$15.0 IRR= 12.6% MIRR= 11.6% Payback= 3.1 years | ||||||
Table (15)
h.1.
To determine: The worst case NPV and the best case NPV.
Explanation of Solution
As per the data the case can be summarized in the following manner:
| Case | Probability | NPV (in thousand $) |
| Worst | 0.25 | ($27.8) |
| Base | 0.50 | 15.0 |
| Best | 0.25 | 57.8 |
Table (16)
Thus, the worst case in the ($27.8) thousand and the best case is the $57.8 thousand.
2.
To determine: The project’s NPV, standard deviation, and coefficient of variation.
Explanation of Solution
Calculation of the expected NPV:
The formula to calculate the expected NPV is,
Substitute 0.25, 0.5 and 0.25 for the probability and ($27.8), $15 and $57.8 for the value of NPV respectively in the above formula.
The expected NPV is $15.
Calculation of the standard deviation:
The formula to calculate the standard deviation is,
Where,
-
-
-
-
- N is the number of states.
Substitute $15 for
The standard deviation is 30.3%.
Calculation of the coefficient of variation:
The formula to calculate the coefficient of variation is,
Substitute 30.3% for the standard deviation and 15% for the expected rate of return in the above formula.
The coefficient of variation is 2.02.
i.
To explain: The classification of risk and the type of risk which is measured here.
Explanation of Solution
The classification of risk is as follows:
- The project has a coefficient of variation is 2.0 which is much higher than the average range of 1.25 to 1.75.
- This falls under the high-risk category.
- The coefficient of variation measures a stand-alone risk.
- This measures the variability of returns about the expected return.
- The standard deviation refers to the stand-alone risk associated with the securities. It measures how much a data is dispersed with its standard value. The Greek letter sigma represents the standard deviation.
- The coefficient of variation is a tool to determine the risk. It determines the risk per unit of return. It is used for measurement when the expected returns are same for two data.
The risk falls under the high-risk category and this type of the risk measures the viability of the returns.
j.
To explain: The way in which the project would be correlated with the firm’s other assets.
Answer to Problem 20IC
The way in which the project would be related to the firm’s other assets is as follows:
- In this case, it is assumed that the economy is strong and the people are buying a lot of lemon juice, then the sales would be strong and there would be a positive correlation between the project and the rest of business.
- All the other line will also be successful as the correlation is less than 1.0.
- The correlation can be within a range of +0.5 to +0.9.
Explanation of Solution
- The correlation refers to the relation between the two things depending on one another.
- The situation of the economy is related to the sales position of a firm.
- And so the project is related to the assets of the firm.
Thus, the project would be correlated with the firm’s other assets.
k.
To explain: The way in which the correlation coefficient and the standard deviation are combined to affect the contribution of the project to corporate or the firm risk.
Explanation of Solution
The way in which these will be combined is as follows:
- If the cash flows of the project have high correlation with the firm’s aggregate cash flows, then the project will have a high corporate risk.
- If the cash flows of the project are expected to be totally uncorrelated with the firm’s aggregate cash flows, then accepting the project will decrease the firm’s total risk.
- In this case, the riskiness would be less than the suggested stand-alone risk.
- If the cash flows of the project are expected to have a negative correlation with the aggregate cash flows, then the project would reduce the total risk of the firm even more.
- The positive correlation refers to the situation where the variables are directly proportional to one another.
- This means if one increases, the other also increases.
- The negative correlation refers to the situation where the variables are inversely proportional to one another.
- This means if one increases, the other decreases.
Thus, the correlation coefficient and the standard deviation affect the contribution of the project and the firm risk in the manner as stated above.
l.
To explain: The effect of project’s correlation coefficient with respect to the general economy and with returns on market and the how this affects the market’s risk.
Answer to Problem 20IC
The effects are explained as follows:
- The given project has a positive correlation with the returns on other assets in the economy, and so with the stock market.
- The company produces food items and so they tend to be less risky than the economy as a whole.
- When the economy is good people spend more on non-essential types of food and cut it down when the economy is weak.
- So, the market risk can be predicted within a range of +0.5 to +0.9.
- If an asset has a high correlation, it has a high beta and so a high market risk.
Explanation of Solution
- The positive correlation refers to the situation where the variables are directly proportional to one another.
- This means if one increases, the other also increases.
- The negative correlation refers to the situation where the variables are inversely proportional to one another.
- This means if one increases, the other decreases.
Thus, the project’s correlation coefficient depends on the economic situations and the market risk.
m.
To explain: The project should be accepted or not after risk adjustment and whether subjective risk factors will be included.
Answer to Problem 20IC
- The project has an above-average risk, after the risk adjustments, so the cost of capital would be 13%.
- At this discount rate, the NPV would be -$2,226 so it would not be acceptable.
- If it is a low-risk project, the cost of capital would be 7% and so the NPV would be $34,117.
- This would be profitable on a risk-adjusted basis.
- If the project has a potential for harmful lawsuits, then the risk should be assessed first.
- If the assets of the project are redeployed within the firm, then the project may be less risky.
Explanation of Solution
- When the risk is adjusted, the project has above-average risk.
- Risks are of many types in a business, low-risk, high risk, average risk and above average risk.
Thus, the project will not be accepted in above-average risk but will be accepted in a low-risk project.
n.1.
To explain: The real options analysis.
Answer to Problem 20IC
- The real options analysis is a valuation technique for the capital budgeting decisions.
- This technique uses a tangible asset instead of any financial instrument. The real options are those choices or opportunities of which a business can take advantage.
- It is a right but not an obligation to take the real business decisions.
- The various types of real options are related to the type of projects, the timing of projects and lifespan of the operation.
Explanation of Solution
- The real options refer to that choice or opportunities in which a business can take advantage or may realize.
- The real options affects the valuation of potential investments, however, the valuations like net present value fail to account for the benefits which are provided by the real options.
Thus, the real options analysis is a technique for valuation used in the capital budgeting decision.
2.
To explain: The examples of projects with embedded real options.
Answer to Problem 20IC
The examples of projects with embedded real options are a call option on a stock and callable or non-callable bond.
Explanation of Solution
- The embedded options are that one which are embedded to more than one or more of the stocks, bonds or any other financial instrument.
- The embedded options cannot be separated from the underlying security.
- This option gives the contract holder a right to exercise the option in the future.
Thus, the examples of embedded real options are call option and callable bonds or non-callable bonds.
Want to see more full solutions like this?
Chapter 12 Solutions
Bundle: Fundamentals of Financial Management, Concise, Loose-Leaf Version, 9th + LMS Integrated for MindTap Finance, 1 term (6 months) Printed Access Card


- Review of Basic Capital Budgeting Procedures Dr. Whitley Avard, a plastic surgeon, had just returned from a conference in which she learned of a new surgical procedure for removing wrinkles around eyes, reducing the time to perform the normal procedure by 50%. Given her patient-load pressures. Dr. Avard is excited to try out the new technique. By decreasing the time spent on eye treatments or procedures, she can increase her total revenues by performing more services within a work period. In order to implement the new procedure, special equipment costing 74,000 is needed. The equipment has an expected life of 4 years, with a salvage value of 6,000. Dr. Avard estimates that her cash revenues will increase by the following amounts: She also expects additional cash expenses amounting to 3,000 per year. The cost of capital is 12%. Assume that there are no income taxes. Required: 1. Compute the payback period for the new equipment. 2. Compute the ARR. Round the percentage to two decimal places. 3. CONCEPTUAL CONNECTION Compute the NPV and IRR for the project. Use 14% as your first guess for IRR. Should Dr. Avard purchase the new equipment? Should she be concerned about payback or the ARR in making this decision? 4. CONCEPTUAL CONNECTION Before finalizing her decision. Dr. Avard decided to call two plastic surgeons who have been using the new procedure for the past 6 months. The conversations revealed a somewhat less glowing report than she received at the conference. The new procedure reduced the time required by about 25% rather than the advertised 50%. Dr. Avard estimated that the net operating cash flows of the procedure would be cut by one-third because of the extra time and cost involved (salvage value would be unaffected). Using this information, recompute the NPV of the project. What would you now recommend?arrow_forwardCash payback period for a service company Janes Clothing Inc. is evaluating two capital investment proposals for a retail outlet, each requiring an investment of 975,000 and each with a seven-year life and expected total net cash flows of 1,050,000. Location 1 is expected to provide equal annual net cash flows of 150,000, and Location 2 is expected to have the following unequal annual net cash flows: Determine the cash payback period for both location proposals.arrow_forwardThe J.R. Ryland Computer Company is considering a plant expansion to enable the company to begin production of a new computer product. The companys president must determine whether to make the expansion a medium- or large-scale project. Demand for the new product is uncertain, which for planning purposes may be low demand, medium demand, or high demand. The probability estimates for demand are 0.20, 0.50, and 0.30, respectively. Letting x and y indicate the annual profit in thousands of dollars, the firms planners developed the following profit forecasts for the medium-and large-scale expansion projects. a. Compute the expected value for the profit associated with the two expansion alternatives. Which decision is preferred for the objective of maximizing the expected profit? b. Compute the variance for the profit associated with the two expansion alternatives. Which decision is preferred for the objective of minimizing the risk or uncertainty?arrow_forward
- Allied Food Products is considering expanding into the fruit juice business with a new fresh lemon juiceproduct. Assume that you were recently hired as assistant to the director of capital budgeting, and youmust evaluate the new project.The lemon juice would be produced in an unused building adjacent to Allied’s Fort Myers plant; Alliedowns the building, which is fully depreciated. The required equipment would cost $450,000, plus anadditional $38,000 for shipping and installation. In addition, inventories would rise by $40,000, whileaccounts payable would increase by $10,000. All of these costs would be incurred at t = 0. By a specialruling, the machinery could be depreciated under the MACRS system as 4-year property. The applicabledepreciation rates are 40%, 30%, 20%, and 10%.The project is expected to operate for 4 years, at which time it will be terminated. The cash inflows areassumed to begin 1 year after the project is undertaken (t = 1), and to continue out to t = 4. At the endof…arrow_forwardAllied Food Products is considering expanding into the fruit juice business with a new fresh lemon juiceproduct. Assume that you were recently hired as assistant to the director of capital budgeting, and youmust evaluate the new project.The lemon juice would be produced in an unused building adjacent to Allied’s Fort Myers plant; Alliedowns the building, which is fully depreciated. The required equipment would cost $450,000, plus anadditional $38,000 for shipping and installation. In addition, inventories would rise by $40,000, whileaccounts payable would increase by $10,000. All of these costs would be incurred at t = 0. By a specialruling, the machinery could be depreciated under the MACRS system as 4-year property. The applicabledepreciation rates are 40%, 30%, 20%, and 10%.The project is expected to operate for 4 years, at which time it will be terminated. The cash inflows areassumed to begin 1 year after the project is undertaken (t = 1), and to continue out to t = 4. At the endof…arrow_forwardAllied Food Products is considering expanding into the fruit juice business with a new fresh lemon juiceproduct. Assume that you were recently hired as assistant to the director of capital budgeting, and youmust evaluate the new project.The lemon juice would be produced in an unused building adjacent to Allied’s Fort Myers plant; Alliedowns the building, which is fully depreciated. The required equipment would cost $450,000, plus anadditional $38,000 for shipping and installation. In addition, inventories would rise by $40,000, whileaccounts payable would increase by $10,000. All of these costs would be incurred at t = 0. By a specialruling, the machinery could be depreciated under the MACRS system as 4-year property. The applicabledepreciation rates are 40%, 30%, 20%, and 10%.The project is expected to operate for 4 years, at which time it will be terminated. The cash inflows areassumed to begin 1 year after the project is undertaken (t = 1), and to continue out to t = 4. At the endof…arrow_forward
- Allied Food Products is considering expanding into the fruit juice business with a new fresh lemon juiceproduct. Assume that you were recently hired as assistant to the director of capital budgeting, and youmust evaluate the new project.The lemon juice would be produced in an unused building adjacent to Allied’s Fort Myers plant; Alliedowns the building, which is fully depreciated. The required equipment would cost $450,000, plus anadditional $38,000 for shipping and installation. In addition, inventories would rise by $40,000, whileaccounts payable would increase by $10,000. All of these costs would be incurred at t = 0. By a specialruling, the machinery could be depreciated under the MACRS system as 4-year property. The applicabledepreciation rates are 40%, 30%, 20%, and 10%.The project is expected to operate for 4 years, at which time it will be terminated. The cash inflows areassumed to begin 1 year after the project is undertaken (t = 1), and to continue out to t = 4. At the endof…arrow_forwardAllied Food Products is considering expanding into the fruit juice business with a new fresh lemon juiceproduct. Assume that you were recently hired as assistant to the director of capital budgeting, and youmust evaluate the new project.The lemon juice would be produced in an unused building adjacent to Allied’s Fort Myers plant; Alliedowns the building, which is fully depreciated. The required equipment would cost $450,000, plus anadditional $38,000 for shipping and installation. In addition, inventories would rise by $40,000, whileaccounts payable would increase by $10,000. All of these costs would be incurred at t = 0. By a specialruling, the machinery could be depreciated under the MACRS system as 4-year property. The applicabledepreciation rates are 40%, 30%, 20%, and 10%.The project is expected to operate for 4 years, at which time it will be terminated. The cash inflows areassumed to begin 1 year after the project is undertaken (t = 1), and to continue out to t = 4. At the endof…arrow_forwardAllied Food Products is considering expanding into the fruit juice business with a new fresh lemon juiceproduct. Assume that you were recently hired as assistant to the director of capital budgeting, and youmust evaluate the new project.The lemon juice would be produced in an unused building adjacent to Allied’s Fort Myers plant; Alliedowns the building, which is fully depreciated. The required equipment would cost $450,000, plus anadditional $38,000 for shipping and installation. In addition, inventories would rise by $40,000, whileaccounts payable would increase by $10,000. All of these costs would be incurred at t = 0. By a specialruling, the machinery could be depreciated under the MACRS system as 4-year property. The applicabledepreciation rates are 40%, 30%, 20%, and 10%.The project is expected to operate for 4 years, at which time it will be terminated. The cash inflows areassumed to begin 1 year after the project is undertaken (t = 1), and to continue out to t = 4. At the endof…arrow_forward
 Managerial AccountingAccountingISBN:9781337912020Author:Carl Warren, Ph.d. Cma William B. TaylerPublisher:South-Western College Pub
 Survey of Accounting (Accounting I)AccountingISBN:9781305961883Author:Carl WarrenPublisher:Cengage Learning
 Managerial Accounting: The Cornerstone of Busines...AccountingISBN:9781337115773Author:Maryanne M. Mowen, Don R. Hansen, Dan L. HeitgerPublisher:Cengage Learning
 Essentials of Business Analytics (MindTap Course ...StatisticsISBN:9781305627734Author:Jeffrey D. Camm, James J. Cochran, Michael J. Fry, Jeffrey W. Ohlmann, David R. AndersonPublisher:Cengage Learning
 Fundamentals of Financial Management, Concise Edi...FinanceISBN:9781305635937Author:Eugene F. Brigham, Joel F. HoustonPublisher:Cengage Learning
 Fundamentals of Financial Management, Concise Edi...FinanceISBN:9781285065137Author:Eugene F. Brigham, Joel F. HoustonPublisher:Cengage Learning