
Concept explainers
Videos
a.
Plot the interaction graph.
Find whether there is an interaction effect on sales.
Describe the interaction effect of machine and position.
a.
Answer to Problem 21E
Yes, there is an interaction effect on sales.
Explanation of Solution
Step-by-step procedure to obtain the interaction plot using MINITAB:
- Choose Stat > ANOVA > Interactions Plot.
- In Responses, enter the column of Sales.
- In Factors, enter the columns of Positions and Machines.
- Click OK.
Output obtained using MINITAB is represented as follows:
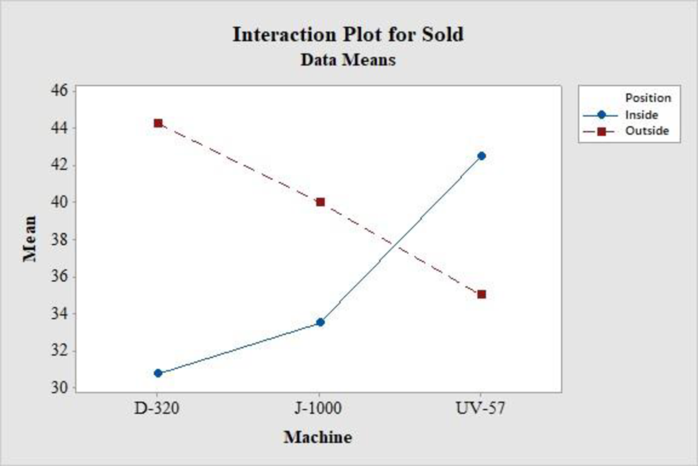
From the above output, the lines are not parallel and the effect of one factor influences the other factor. Therefore, there is an interaction effect of position and machines on the sales.
From the above graph, one can observe the following things:
The mean sales of food using Machine UV-57 is more inside position than outside. The mean sales of food using Machine J-1000 is better outside and Machine D-320 is better outside.
b.
Compute an ANOVA to test for position, machine, and interaction effects on sales at the 0.05 significance level.
Report the statistical results.
b.
Answer to Problem 21E
There is an effect of position on sales.
There is no effect of machine on sales.
There is an interaction effect on sales.
Explanation of Solution
The null and alternative hypotheses for main effects are stated below:
Position:
Machines:
The null and alternative hypotheses of interaction effect are follows:
Step-by-step procedure to obtain the test statistic using MINITAB:
- Choose Stat > ANOVA >General Linear Model>Fit General Linear Model.
- Select on Sales and send into Response.
- Select on Position, Machine and send them into Factors.
- Choose Model and Add Interaction through Order (2).
- Click Ok.
Output obtained using MINITAB is represented as follows:
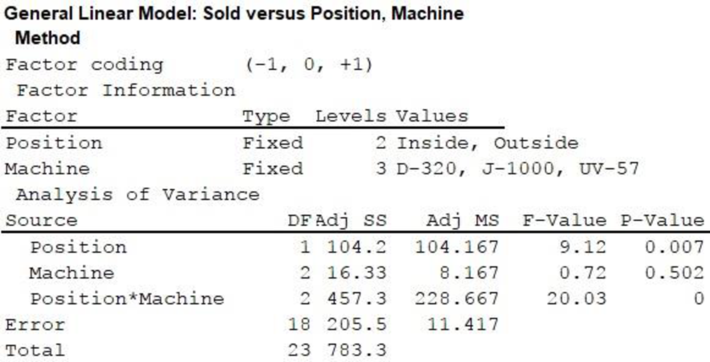
From the above output, the F test statistic for Position is 9.12 and its corresponding p-value is 0.007. The F test statistic for Machine is 0.72, and its p-value is 0.502. The F-statistic for interaction is 20.03, and its corresponding p-value is 0.000.
Decision Rule:
If the p-value is less than the level of significance, reject the null hypothesis. Otherwise, fail to reject the null hypothesis.
Conclusion:
The level of significance is 0.05.
Position:
From the given output, the F test statistic for Position is 9.12 and the p-value is 0.007.
The p-value is less than the level of significance 0.05. Hence, one can reject the null hypothesis at the 0.05 significance level.
There is an effect of position on the sales of food.
Machine:
The F test statistic for Machine is 0.72, and its p-value is 0.502.
The p-value is greater than the level of significance 0.05. Hence, one is failed to reject the null hypothesis at the 0.05 significance level.
Thus, there is no effect of machines on the sales of food.
Interaction:
Here, the F-statistic for interaction is 20.03, and its corresponding p-value is 0.000.
The p-value is less than the level of significance. Therefore, there is an interaction effect on the sales of food.
c.
Compare the inside and outside mean sales for each machine.
c.
Answer to Problem 21E
The mean sales of inside and outside for machines D-320 and UV-57 are different except for machine J-1000.
Explanation of Solution
Machine J-1000:
The null and alternative hypotheses are as follows:
Step-by-step procedure to obtain the test statistic using Excel MegaStat:
- In EXCEL, Select Add-Ins > Mega Stat > Hypothesis Tests.
- Choose Compare Two Independent Groups.
- Choose Data Input.
- In Group 1, enter the column of Inside.
- In Group 2, enter the column of outside.
- Enter 0 Under Hypothesized difference.
- Check t-test (unequal variance), enter Confidence level as 95.0.
- Choose not equal in alternative.
- Click OK.
Output obtained using Excel MegaStat is represented as follows:
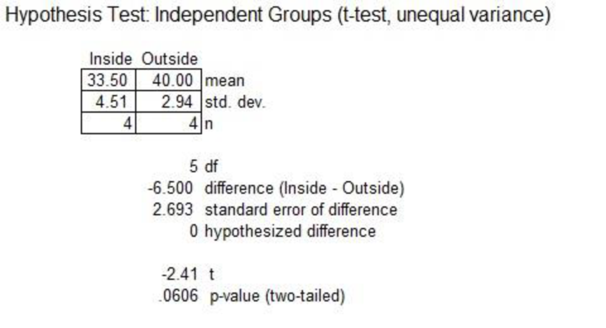
From the above output, the t- test statistic is –2.41. The p-value is 0.0606.
Conclusion:
The level of significance is 0.05. The p-value is greater than the level of significance.
Thus, one is failed to reject the null hypothesis at the 0.05 significance level.
The mean sales of inside and outside for machine J-1000 are equal.
Machine D-320:
Output obtained using Excel MegaStat is represented as follows:
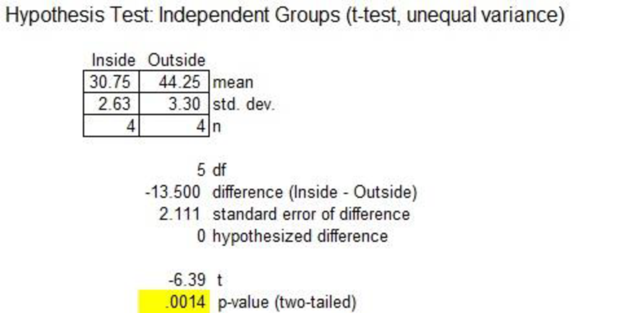
From the above output, the t- test statistic is –6.39. The p-value is 0.0014.
Conclusion:
The level of significance is 0.05. The p-value is less than the level of significance. One can reject the null hypothesis at the 0.05 significance level.
Thus, the mean sales of inside and outside for machine D-320 are different.
Machine UV-57:
Output obtained using Excel MegaStat is represented as follows:
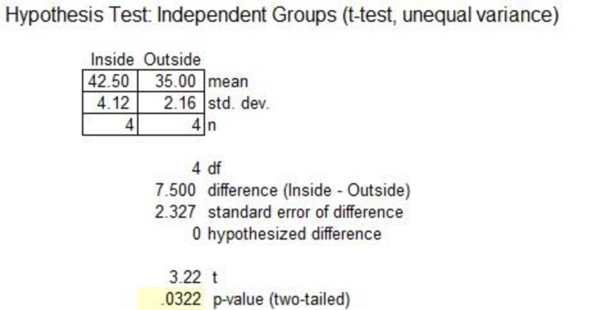
From the above output, the t- test statistic is 3.22. The p-value is 0.0322.
Conclusion:
The level of significance is 0.05. The p-value is less than the level of significance. One can reject the null hypothesis at the 0.05 significance level. Therefore, the mean sales of inside and outside for machine UV-57 are different.
Want to see more full solutions like this?
Chapter 12 Solutions
Statistical Techniques in Business and Economics, 16th Edition


 Glencoe Algebra 1, Student Edition, 9780079039897...AlgebraISBN:9780079039897Author:CarterPublisher:McGraw Hill
 Holt Mcdougal Larson Pre-algebra: Student Edition...AlgebraISBN:9780547587776Author:HOLT MCDOUGALPublisher:HOLT MCDOUGAL