
Concept explainers
Videos
a.
Find whether there is a difference in the variation in team salary among the people from Country A and National league teams.
a.
Answer to Problem 50DE
There is no difference in the variance in team salary among the people from Country A and National league teams.
Explanation of Solution
The null and alternative hypotheses are stated below:
Null hypothesis: There is no difference in the variance in team salary among Country A and National league teams.
Alternative hypothesis: There is difference in the variance in team salary among Country A and National league teams.
Step-by-step procedure to obtain the test statistic using Excel:
- In the first column, enter the salaries of Country A’s team.
- In the second column, enter the salaries of National team.
- Select the Data tab on the top menu.
- Select Data Analysis and Click on: F-Test, Two-sample for variances and then click on OK.
- In the dialog box, select Input
Range . - Click OK
Output obtained using Excel is represented as follows:
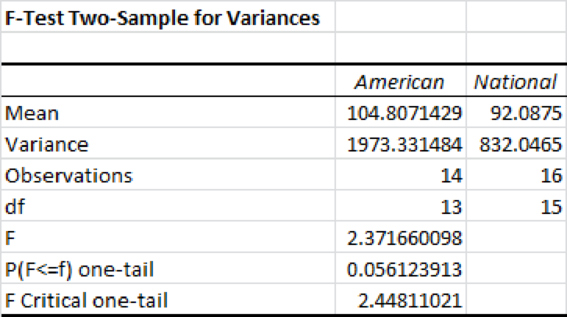
From the above output, the F- test statistic value is 2.37 and its p-value is 0.056.
Decision Rule:
If the p-value is less than the level of significance, reject the null hypothesis. Otherwise, fail to reject the null hypothesis.
Conclusion:
The significance level is 0.05. The p-value is 0.056 and it is greater than the significance level. The null hypothesis is rejected at the 0.05 significance level.
Thus, there is no difference in the variance in team salary among Country A and National league teams.
b.
Create a variable that classifies a team’s total attendance into three groups.
Find whether there is a difference in the mean number of games won among the three groups.
b.
Answer to Problem 50DE
There is no difference in the mean number of games won among the three groups.
Explanation of Solution
Let X represent the total attendance into three groups. Samples 1, 2, and 3 are “less than 2 (million)”, 2 up to 3, and 3 or more attendance of teams of three groups, respectively.
The following table gives the number of games won by the three groups of attendances.
| Sample 1 | Sample 2 | Sample 3 |
| 85 | 81 | 69 |
| 68 | 94 | 88 |
| 55 | 93 | 89 |
| 72 | 61 | 86 |
| 94 | 97 | 74 |
| 75 | 64 | 81 |
| 69 | 94 | |
| 83 | 88 | |
| 66 | 93 | |
| 95 | ||
| 79 | ||
| 76 | ||
| 73 | ||
| 98 |
The null and alternative hypotheses are as follows:
Null hypothesis: There is no difference in the mean number of games won among the three groups.
Alternative hypothesis: There is a difference in the mean number of games won among the three groups
Step-by-step procedure to obtain the test statistic using Excel:
- In Sample 1, enter the number of games won by the team, which is less than 2 million attendances.
- In Sample 2, enter the number of games won by the team of 2 up to 3 million attendances.
- In Sample 3, enter the number of games won by the team of 3 or more million attendances.
- Select the Data tab on the top menu.
- Select Data Analysis and Click on: ANOVA: Single factor and then click on OK.
- In the dialog box, select Input Range.
- Click OK
Output obtained using Excel is represented as follows:
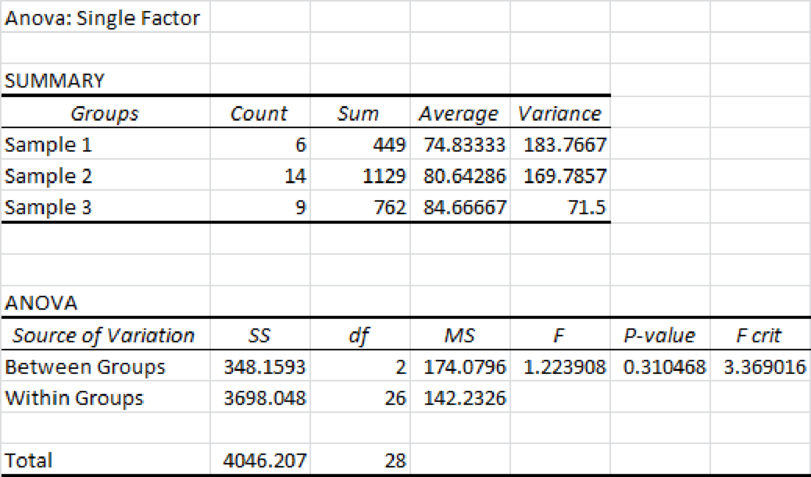
From the above output, the F test statistic value is 1.22 and the p-value is 0.31.
Conclusion:
The level of significance is 0.05. The p-value is greater than the significance level. Hence, one can fail to reject the null hypothesis at the 0.05 significance level. Thus, there is no difference in the mean number of games won among the three groups.
c.
Find whether there is a difference in the mean number of home runs hit per team using the variable defined in Part b.
c.
Answer to Problem 50DE
There is no difference in the mean number of home runs hit per team.
Explanation of Solution
The null and alternative hypotheses are stated below:
Null hypothesis: There is no difference in the mean number of home runs hit per team.
Alternative hypothesis: There is a difference in the mean number of home runs hit per team.
The following table gives the number of home runs per each team, which is defined in Part b.
| Sample 1 | Sample 2 | Sample 3 |
| 211 | 165 | 165 |
| 136 | 149 | 163 |
| 146 | 214 | 187 |
| 131 | 137 | 116 |
| 195 | 172 | 245 |
| 149 | 166 | 158 |
| 175 | 137 | 103 |
| 202 | 159 | |
| 131 | 200 | |
| 139 | ||
| 170 | ||
| 121 | ||
| 198 | ||
| 194 |
Step-by-step procedure to obtain the test statistic using Excel:
- In Sample 1, enter the number of home runs hit by the group of less than 2 million attendances.
- In Sample 2, enter the number of home runs hit by the group of 2 up to 3 million attendances.
- In Sample 3, enter the number of home runs hit by the group of 3 or more million attendances.
- Select the Data tab on the top menu.
- Select Data Analysis and Click on: ANOVA: Single factor and then click on OK.
- In the dialog box, select Input Range.
- Click OK
Output obtained using Excel is represented as follows:
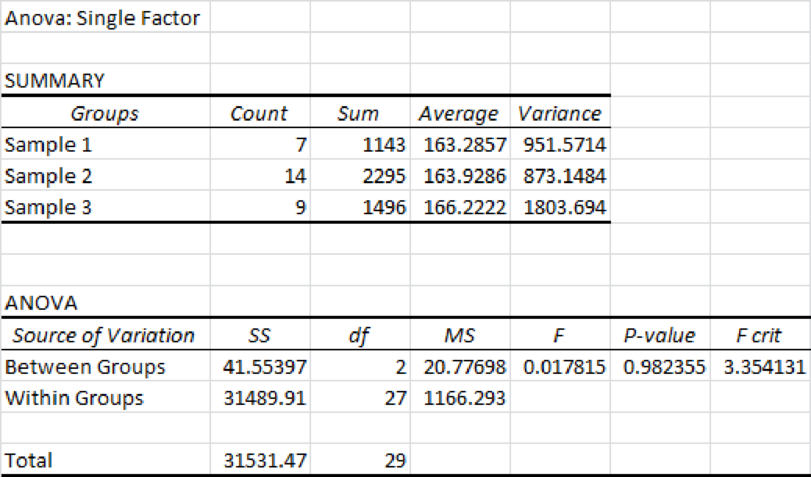
From the above output, the F test statistic value is 0.018 and the p-value is 0.9823.
Conclusion:
The level of significance is 0.05 and the p-value is greater than the significance level. Hence, one fails to reject the null hypothesis at the 0.05 significance level. Thus, there is no difference in the mean number of home runs hit per team.
d.
Find whether there is a difference in the mean salary of the three groups.
d.
Answer to Problem 50DE
The mean salaries are different for each group.
Explanation of Solution
The null and alternative hypotheses are stated below:
Null hypothesis: The mean salary of the three groups is equal.
Alternative hypothesis: At least one mean salary is different from other.
The following table provides the salary of each group that is defined in Part b.
| Sample 1 | Sample 2 | Sample 3 |
| 96.9 | 74.3 | 173.2 |
| 78.4 | 83.3 | 132.3 |
| 60.7 | 81.4 | 154.5 |
| 60.9 | 88.2 | 95.1 |
| 55.4 | 82.2 | 198 |
| 82 | 78.1 | 174.5 |
| 64.2 | 118.1 | 117.6 |
| 97.7 | 110.3 | |
| 94.1 | 120.5 | |
| 93.4 | ||
| 63.4 | ||
| 55.2 | ||
| 75.5 | ||
| 81.3 |
Step-by-step procedure to obtain the test statistic using Excel:
- In Sample 1, enter the salary of the group of less than 2 million attendances.
- In Sample 2, enter the salary of the group of 2 up to 3 million attendances.
- In Sample 3, enter the salary of the group of 3 or more million attendances.
- Select the Data tab on the top menu.
- Select Data Analysis and Click on: ANOVA: Single factor and then click on OK.
- In the dialog box, select Input Range.
- Click OK
Output obtained using Excel is represented as follows:
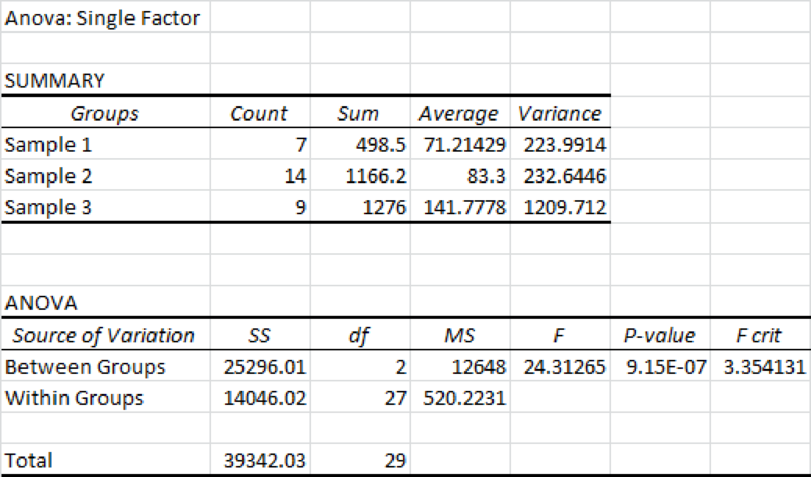
From the above output, the F test statistic value is 24.31 and the p-value is 0.
Conclusion:
The level of significance is 0.05 and the p-value is less than the significance level. Hence, one can reject the null hypothesis at the 0.05 significance level. Thus, the mean salaries are different for each group.
Want to see more full solutions like this?
Chapter 12 Solutions
Statistical Techniques in Business and Economics, 16th Edition


 Glencoe Algebra 1, Student Edition, 9780079039897...AlgebraISBN:9780079039897Author:CarterPublisher:McGraw Hill