
Concept explainers
Videos
To create the following data we started with the same sample means and variances that appeared in problem 21 but doubled the
a. Predict how the increase in sample size should affect the F-ratio for these data compares to the values obtained in problem 21. Use an ANOVA with a – .05 to check your prediction. Note: Recause the sample are all the same size, MSwithin is the average of the three sample variances.
b. Predict how the increase in sample size should affect the value of η’ for these data compared to the η’ in problem 21. Calculate η’ to check your prediction.
a.
To predict: The effect on size of the F-ratio after increase in sample size.
To determine: There are any significant mean differences between treatments.
Answer to Problem 22P
On increasing the sample size, the size of F-ratio increases. There are significant mean differences between the treatments.
Explanation of Solution
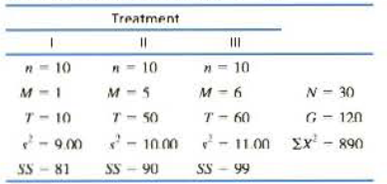
Given info:
| Treatment | |||
| I | II | III | |
|
|
|
|
|
|
|
|
|
|
|
|
|
|
|
|
|
|
|
|
|
|
|
|
|
Level of significance is
Calculation:
On increasing the sample size, the sum of squares between treatments increases, hence numerator of the F-ratio increases. Therefore, size of F-ratio increases and chances to reject the null hypothesis increases.
Let k represents the numbers of treatments. Then,
Then, degrees of freedom corresponding to
Then, degrees of freedom corresponding to
Sum of squares between treatments is given as:
F-ratio is calculated as:
From the table
Since, F-ratio is greater than the critical value; therefore, the null hypothesis is rejected and conclude that there are significant mean differences between the treatments.
Conclusion:
On increasing the sample size, the size of F-ratio increases. There are significant mean differences between the treatments.
b.
To predict: The effect of increase in sample size on the effect size
To determine: The effect size
Answer to Problem 22P
On increasing the sample size: the effect size
Explanation of Solution
Calculation:
The formula for
On increasing the sample size, the sum of squares between treatments increases more rapidly than total sum of squares, so numerator becomes larger. Hence, the effect size
Sum of squares between treatments is given as:
Total sum of squares is calculated as:
The effect size for the study is given as:
Conclusion:
On increasing the sample size: the effect size
Want to see more full solutions like this?
Chapter 12 Solutions
ESSEN STATS FOR BEHAVIORAL SCI LL + A.C


 MATLAB: An Introduction with ApplicationsStatisticsISBN:9781119256830Author:Amos GilatPublisher:John Wiley & Sons Inc
 Probability and Statistics for Engineering and th...StatisticsISBN:9781305251809Author:Jay L. DevorePublisher:Cengage Learning
 Statistics for The Behavioral Sciences (MindTap C...StatisticsISBN:9781305504912Author:Frederick J Gravetter, Larry B. WallnauPublisher:Cengage Learning
 Elementary Statistics: Picturing the World (7th E...StatisticsISBN:9780134683416Author:Ron Larson, Betsy FarberPublisher:PEARSON
 The Basic Practice of StatisticsStatisticsISBN:9781319042578Author:David S. Moore, William I. Notz, Michael A. FlignerPublisher:W. H. Freeman
 Introduction to the Practice of StatisticsStatisticsISBN:9781319013387Author:David S. Moore, George P. McCabe, Bruce A. CraigPublisher:W. H. Freeman