Mathematics for the Trades: A Guided Approach (11th Edition) (What's New in Trade Math)
11th Edition
ISBN: 9780134756967
Author: Hal Saunders, Robert Carman
Publisher: PEARSON
expand_more
expand_more
format_list_bulleted
Concept explainers
Videos
Textbook Question
Chapter 12, Problem 29APS
Graph IV Automotive Trades
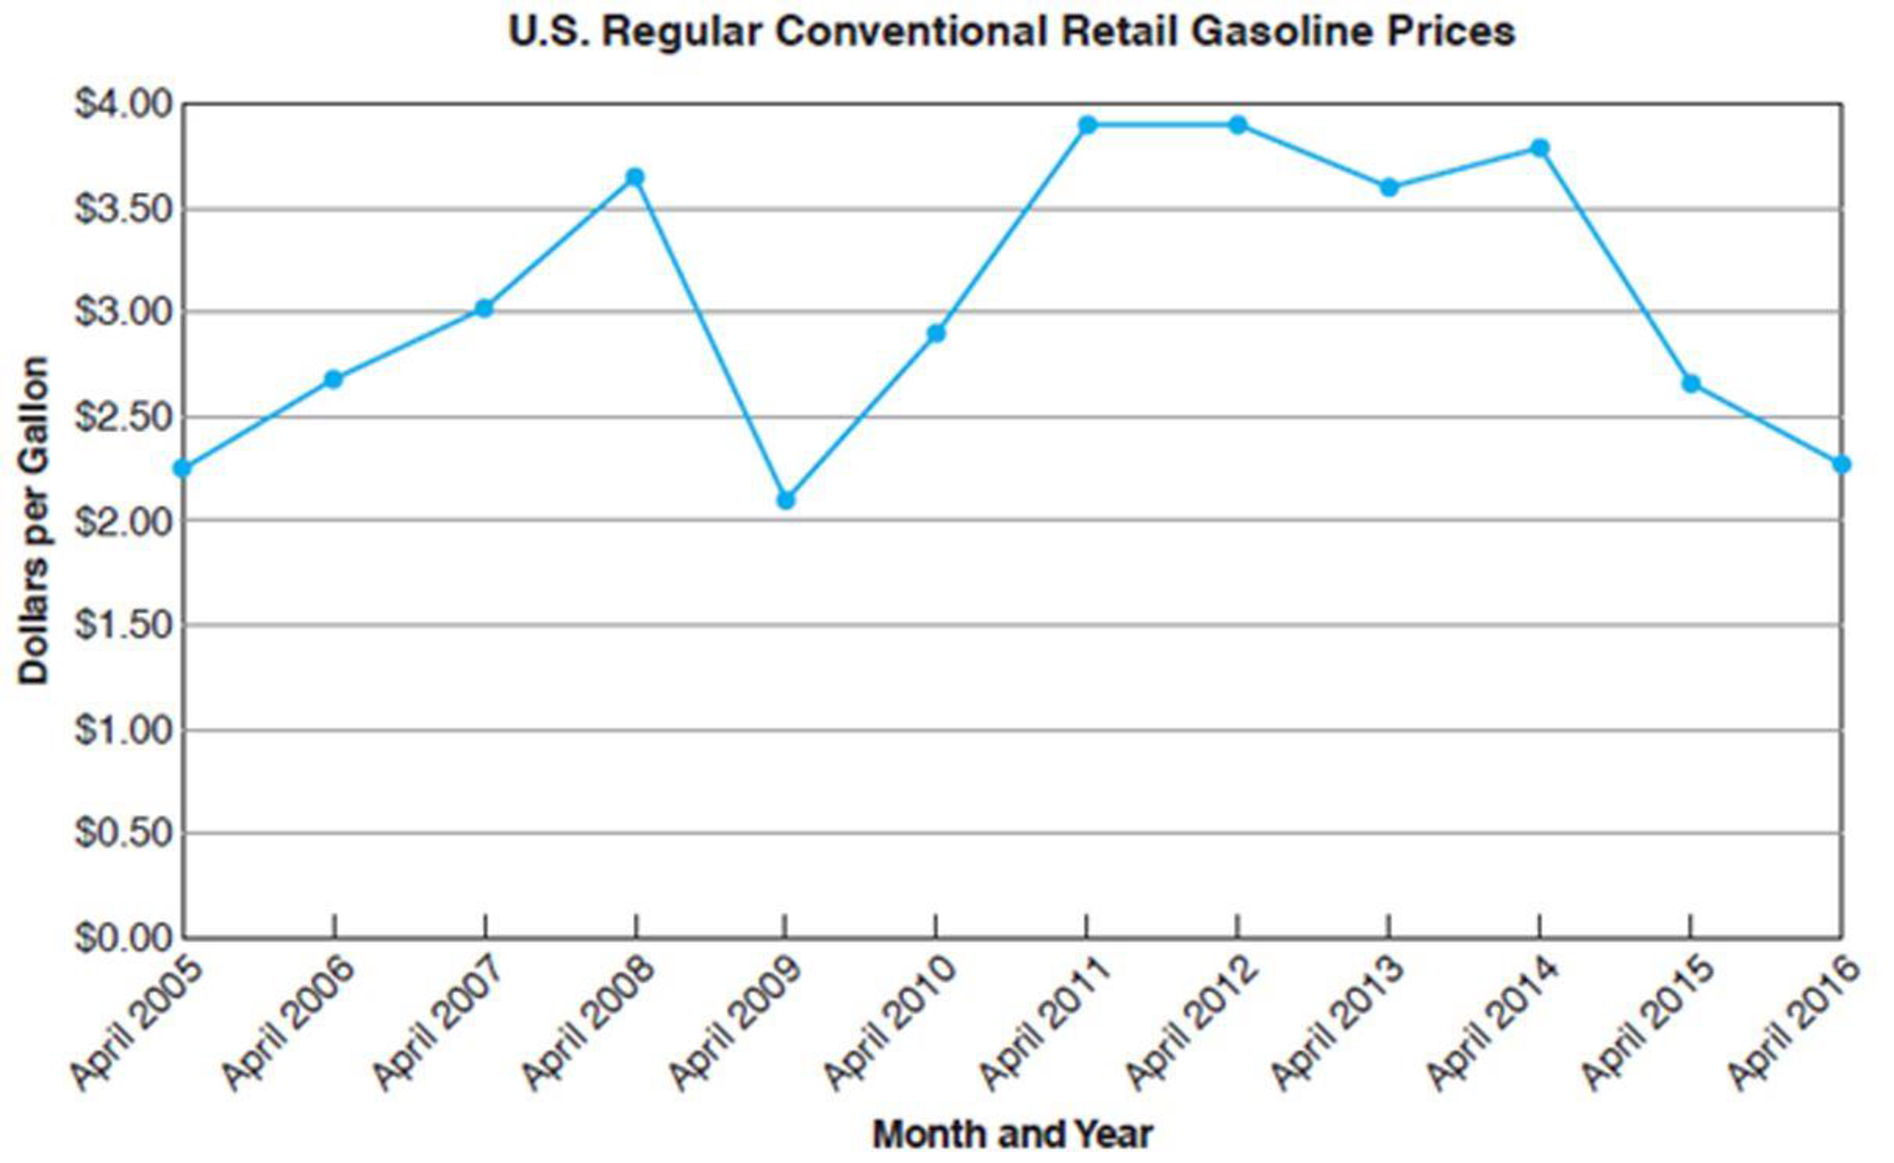
By what percent did the cost decrease from April 2012 to April 2016?
Expert Solution & Answer
Want to see the full answer?
Check out a sample textbook solution
Students have asked these similar questions
A Christmas traveling at 65 miles per hour on the interstate. Where graph shows the relationship between the time spent traveling in hours and the total number of miles traveled.
Archie plotted the points on the graph below to show how the amount he owes for tuition decreases as the number of tuition payments increases. What does the rate of change of the points represent?
John charges $250 to cut people's grass and cuts the grass 4 times a month. On a graph how much money he charges to cut grass, how much he makes in a month, and how much money does he make a year?
Chapter 12 Solutions
Mathematics for the Trades: A Guided Approach (11th Edition) (What's New in Trade Math)
Ch. 12.1 - Solve: 0.82=x100Ch. 12.1 - Prob. 2LCCh. 12.1 - Automotive Trades The following bar graph shows...Ch. 12.1 - Trades Management The following graph shows the...Ch. 12.1 - General Interest The following double bar graph...Ch. 12.1 - General Interest The following stacked bar graph...Ch. 12.1 - Allied Health When Dr. Friedrich began working at...Ch. 12.1 - Automotive Trades The following line graph shows...Ch. 12.1 - Construction The following double-line graph...Ch. 12.1 - General Interest Study the circle graph at the top...
Ch. 12.1 - Prob. 9AECh. 12.1 - Allied Health An assistant at a pharmaceutical...Ch. 12.1 - Fire Protection Plot the following data as a bar...Ch. 12.1 - Transportation The following table lists the total...Ch. 12.1 - Metalworking Draw a bar graph from the following...Ch. 12.1 - Trades Management Plot the following data as a bar...Ch. 12.1 - Construction Plot the following data as a double...Ch. 12.1 - General Interest The following table shows the...Ch. 12.1 - Automotive Trades The following table shows the...Ch. 12.1 - Trades Management The following table shows the...Ch. 12.1 - General Interest The following table shows, by...Ch. 12.1 - Agriculture The following table shows the price...Ch. 12.1 - Allied Health The following table shows the...Ch. 12.1 - General Interest The following data show the U.S....Ch. 12.1 - Fire Protection The following data show the number...Ch. 12.1 - General Interest The following table shows the...Ch. 12.1 - Hydrology The following table shows the daily...Ch. 12.1 - Business and Finance Plot a double broken-line...Ch. 12.1 - Electrical Engineering Plot the following data as...Ch. 12.1 - Water/Wastewater Treatment The following table...Ch. 12.1 - Aviation An aircraft mechanic spends 12.5% of a...Ch. 12.1 - General Interest Recent surveys have shown that...Ch. 12.2 - Find the average of these numbers: 6, 8, 12, 14Ch. 12.2 - What number is halfway between 12 and 15?Ch. 12.2 - Find the mean, median, and mode for each set of...Ch. 12.2 - A. Find the mean, median, and mode for each set of...Ch. 12.2 - A. Find the mean, median, and mode for each set of...Ch. 12.2 - A. Find the mean, median, and mode for each set of...Ch. 12.2 - A. Find the mean, median, and mode for each set of...Ch. 12.2 - A. Find the mean, median, and mode for each set of...Ch. 12.2 - A. Find the mean, median, and mode for each set of...Ch. 12.2 - A. Find the mean, median, and mode for each set of...Ch. 12.2 - Construct an extended frequency distribution for...Ch. 12.2 - Construct an extended frequency distribution for...Ch. 12.2 - Aviation BF Goodrich produces brake pads for...Ch. 12.2 - General Trades The U.S. Department of Labor...Ch. 12.2 - Forestry The following table shows both the total...Ch. 12.2 - Water/Wastewater Treatment The seven-day mean of...Ch. 12.2 - Automotive Trades A mechanic has logged the...Ch. 12.2 - Forestry A forest ranger wishes to determine the...Ch. 12.2 - Hydrology The following table shows the monthly...Ch. 12.2 - Meteorology The National Weather Service provides...Ch. 12.2 - Automotive Trades The following table shows both...Ch. 12.2 - Hydrology The following table shows the daily...Ch. 12.2 - Allied Health The Apgar score is widely used to...Ch. 12.2 - Allied Health A pharmacist keeps careful track of...Ch. 12.2 - Prob. 13CECh. 12.2 - Prob. 14CECh. 12.3 - Calculate: 65 72.5Ch. 12.3 - Calculate: (2.5)2Ch. 12.3 - Prob. 1AECh. 12.3 - Prob. 2AECh. 12.3 - Prob. 3AECh. 12.3 - Calculate the range and the standard deviation for...Ch. 12.3 - Prob. 5AECh. 12.3 - Calculate the range and the standard deviation for...Ch. 12.3 - Prob. 7AECh. 12.3 - Prob. 8AECh. 12.3 - Prob. 1BECh. 12.3 - Prob. 2BECh. 12.3 - Prob. 3BECh. 12.3 - Calculate the standard deviation of the grouped...Ch. 12.3 - Prob. 1CECh. 12.3 - For each set of data, (a) calculate the standard...Ch. 12.3 - Prob. 1DECh. 12.3 - For each set of data, (a) calculate the standard...Ch. 12.3 - Prob. 1EECh. 12.3 - Prob. 2EECh. 12.3 - Prob. 3EECh. 12.3 - Prob. 4EECh. 12.3 - Prob. 5EECh. 12.3 - Prob. 6EECh. 12.3 - Prob. 7EECh. 12.3 - Prob. 8EECh. 12.3 - Prob. 9EECh. 12.3 - Prob. 10EECh. 12.3 - Prob. 11EECh. 12.3 - Prob. 12EECh. 12.3 - Prob. 13EECh. 12.3 - Automotive Trades In testing the acceleration from...Ch. 12 - Read bar graphs, line graphs, and circle graphs....Ch. 12 - Prob. 2PCh. 12 - Prob. 3PCh. 12 - Prob. 4PCh. 12 - Prob. 5PCh. 12 - Prob. 6PCh. 12 - Graph I Electrical Trades In general, as amps...Ch. 12 - Graph I Electrical Trades What is the minimum size...Ch. 12 - Graph I Electrical Trades What is the minimum wire...Ch. 12 - Prob. 4APSCh. 12 - Prob. 5APSCh. 12 - How many grams of fat are contained in a Peanut...Ch. 12 - How many grams of sugar are contained in a...Ch. 12 - How many grams of fat would you consume if you ate...Ch. 12 - How many grams of sugar would you consume if you...Ch. 12 - How many more grams of fat are in two Caramel...Ch. 12 - How many more grams of sugar are in three Peanut...Ch. 12 - Which cookie appears to be the healthiest (as...Ch. 12 - Which cookie appears to be the least healthy (as...Ch. 12 - By what percent does the amount of fat in a...Ch. 12 - By what percent does the amount of sugar in a...Ch. 12 - Retail Merchandising A small computer store is...Ch. 12 - Retail Merchandising A small computer store is...Ch. 12 - Retail Merchandising A small computer store is...Ch. 12 - Retail Merchandising A small computer store is...Ch. 12 - In September, what was the ratio of computer...Ch. 12 - Retail Merchandising A small computer store is...Ch. 12 - Retail Merchandising A small computer store is...Ch. 12 - Retail Merchandising A small computer store is...Ch. 12 - Graph IV Automotive Trades What was the cost per...Ch. 12 - Graph IV Automotive Trades When was the next time...Ch. 12 - Graph IV Automotive Trades During which time...Ch. 12 - Graph IV Automotive Trades During which time...Ch. 12 - Graph IV Automotive Trades What was the difference...Ch. 12 - Graph IV Automotive Trades By what percent did the...Ch. 12 - Graph IV Automotive Trades How much more did it...Ch. 12 - Graph V Business and Finance What was the actual...Ch. 12 - Graph V Business and Finance What was the...Ch. 12 - Graph V Business and Finance During which month...Ch. 12 - Graph V Business and Finance During which month...Ch. 12 - Graph V Business and Finance During which month...Ch. 12 - Graph V Business and Finance During which month...Ch. 12 - Graph V Business and Finance During which months...Ch. 12 - Graph V Business and Finance During which month...Ch. 12 - Graph VI Metalworking What percent of marine...Ch. 12 - Graph VI Metalworking What percent of this alloy...Ch. 12 - Graph VI Metalworking Without measuring, calculate...Ch. 12 - Graph VI Metalworking How many ounces of zinc are...Ch. 12 - Graph VI Metalworking How many grams of bismuth...Ch. 12 - Prob. 1BPSCh. 12 - General Interest The following table shows the...Ch. 12 - Prob. 3BPSCh. 12 - Prob. 4BPSCh. 12 - Prob. 5BPSCh. 12 - Prob. 6BPSCh. 12 - Metalworking Construct a circle graph based on the...Ch. 12 - Fire Protection Construct a circle graph based on...Ch. 12 - General Interest Students in a community college...Ch. 12 - C. Find the mean, median, and mode for each set of...Ch. 12 - C. Find the mean, median, and mode for each set of...Ch. 12 - C. Find the mean, median, and mode for each set of...Ch. 12 - C. Find the mean, median, and mode for each set of...Ch. 12 - Prob. 5CPSCh. 12 - C. Find the mean, median, and mode for each set of...Ch. 12 - D. Calculate (a) the range and (b) the standard...Ch. 12 - D. Calculate (a) the range and (b) the standard...Ch. 12 - Prob. 3DPSCh. 12 - Prob. 4DPSCh. 12 - E. Calculate the mean and the standard deviation...Ch. 12 - Prob. 2EPSCh. 12 - Prob. 1FPSCh. 12 - Meteorology The following table shows the average...Ch. 12 - Agriculture The following data from the United...Ch. 12 - Industrial Technology The Energy Information...Ch. 12 - Police Science To determine the speed that a...Ch. 12 - Agriculture The following list of numbers...Ch. 12 - Sheet Metal Trades The following data represent...Ch. 12 - Prob. 8FPSCh. 12 - Prob. 9FPS
Knowledge Booster


Learn more about
Need a deep-dive on the concept behind this application? Look no further. Learn more about this topic, subject and related others by exploring similar questions and additional content below.Similar questions
- If you graph a revenue and cost function, explain how to determine in what regions there is profit.arrow_forwardThe line graph shows Calvin's savings account balance at the end of each month for 6 months. About how much more money did Calvin have in his account at the end of June than at the end of February?arrow_forwardYou buy a new car for $25,000 and 2 years later, the car is valued at $17,500. Assuming that the depreciation is linear, write a linear depreciation function and graph that models this situation and use that equation to find when the car is worth $5,000?arrow_forward
- Create a line graph of the data using Excel. For how many of the years was the deficit greater than or equal to $320 million?arrow_forwardSuppose classmates who graduated in 2004 compared their median incomes ten years later. The bar graph displays the median income, in thousands of dollars, for each classmate during the time intervals from 2005‑2009 and 2010‑2014. For the individual with the largest dollar value increase in median income over the two time intervals, determine the amount of increase.arrow_forwardIn the graph below, find the percentage of students who were born in the month of July?arrow_forward
- Over the past ten years, a small business owner has made at most $8,000 in profits each week.Which graph represents the business owner's possible profits each week?arrow_forwardJim purchased a new car fo $28,000 in 2007. The line graph shows how its value depreciated for each of the 8 years after the purchase. In what year did the car's value drop to 50% below its original value? 2009 2011 2008 2010arrow_forwardExpress the rate of inflation from 1985 to 2015 as a percent correct to two decimal places. (see graph)arrow_forward
- The graph above shows the average measures of the length of tooth growth in guinea pigs based on vitamin C dose given. Based on the graph, do you think there is a difference in tooth length based on the Vitamin C dose given? Explain.arrow_forwardUse the line graph in Figure to determine the percentage of marriages ending in divorce after 15 years when the wife is under 18 at the time of marriage.arrow_forwardYou buy a new car for the price of $28,750 and, on average, that car’s value will depreciate by 18.25% each year. Use a graphing calculator to determine the time when your car’s value will be just $10,000 to the nearest year.arrow_forward
arrow_back_ios
arrow_forward_ios
Recommended textbooks for you

 Glencoe Algebra 1, Student Edition, 9780079039897...AlgebraISBN:9780079039897Author:CarterPublisher:McGraw Hill
 College Algebra (MindTap Course List)AlgebraISBN:9781305652231Author:R. David Gustafson, Jeff HughesPublisher:Cengage Learning
 Big Ideas Math A Bridge To Success Algebra 1: Stu...AlgebraISBN:9781680331141Author:HOUGHTON MIFFLIN HARCOURTPublisher:Houghton Mifflin Harcourt
Glencoe Algebra 1, Student Edition, 9780079039897...
Algebra
ISBN:9780079039897
Author:Carter
Publisher:McGraw Hill
College Algebra (MindTap Course List)
Algebra
ISBN:9781305652231
Author:R. David Gustafson, Jeff Hughes
Publisher:Cengage Learning
Big Ideas Math A Bridge To Success Algebra 1: Stu...
Algebra
ISBN:9781680331141
Author:HOUGHTON MIFFLIN HARCOURT
Publisher:Houghton Mifflin Harcourt
Learn Algebra 6 : Rate of Change; Author: Derek Banas;https://www.youtube.com/watch?v=Dw701mKcJ1k;License: Standard YouTube License, CC-BY