
Concept explainers
Videos
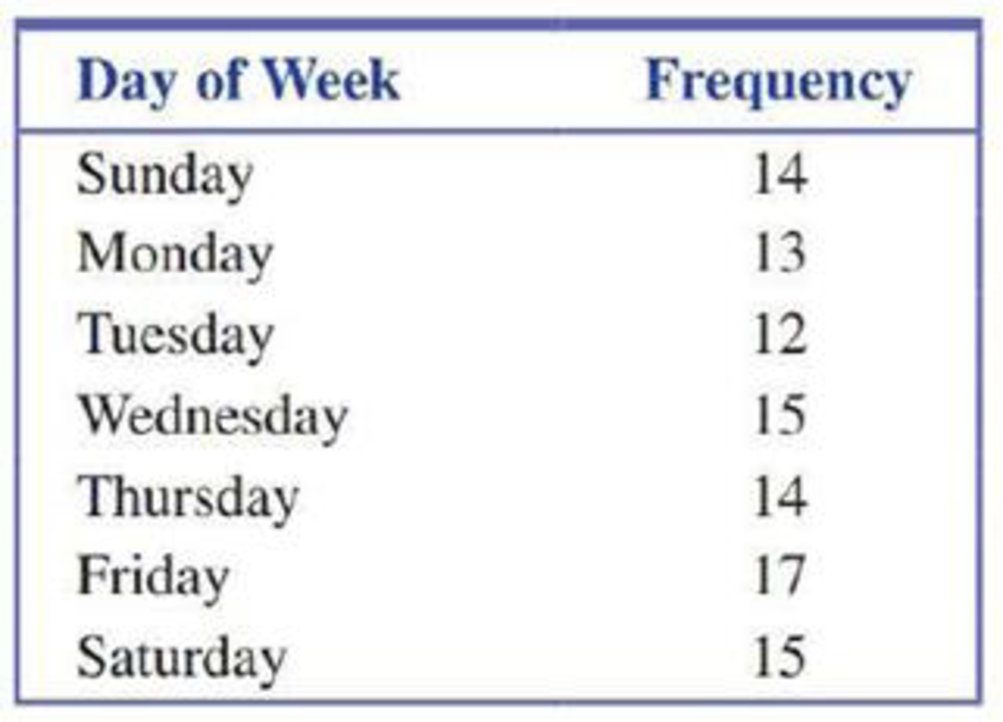
Each observation in a random sample of 100 bicycle accidents resulting in death was classified according to the day of the week on which the accident occurred. Data consistent with information given on the web site highwaysafety.com are given in the following table
Based on these data, is it reasonable to conclude that the proportion of accidents is not the same for all days of the week? Use α = 0.05.
Test whether the proportion of accidents is same for all days of the week at 0.05 significance level.
Answer to Problem 32CR
There is no convincing evidence that the proportion of accidents is not same for all the days of the week
Explanation of Solution
The given table represents number of accidents on each days of the week.
In order to test the proportion of accidents is same for all days of the week, the appropriate test is
The nine step hypotheses testing procedure for goodness-of-fit test is given below.
1. The proportion of accidents on Sunday is
2. Null hypothesis:
3. Alternative hypothesis:
4. Significance level:
5. Test statistic:
6. Assumptions:
- It is given that the observation of 100 bicycle accidents are random samples.
- The expected cell counts are calculated as shown below.
Here, Total frequency, n = 100
| Day | Observed count | Expected count |
| Sunday | 14 | |
| Monday | 13 | |
| Tuesday | 12 | |
| Wednesday | 15 | |
| Thursday | 14 | |
| Friday | 17 | |
| Saturday | 15 | |
| Total | 100 | 100 |
From the expected cell counts table, it is observed that all the expected counts are greater than 5.
7. Calculation:
Software procedure:
Step-by-step procedure to obtain the test statistics and P-value using the MINITAB software is as follows:
- Choose Stat > Tables > Chi-Square Goodness-of-Fit Test (One Variable).
- In Observed counts, enter the column of Frequency.
- In Category names, enter the column of Day.
- Under Test, select Equal Proportion.
- Click OK.
Output using the MINITAB software is given below:
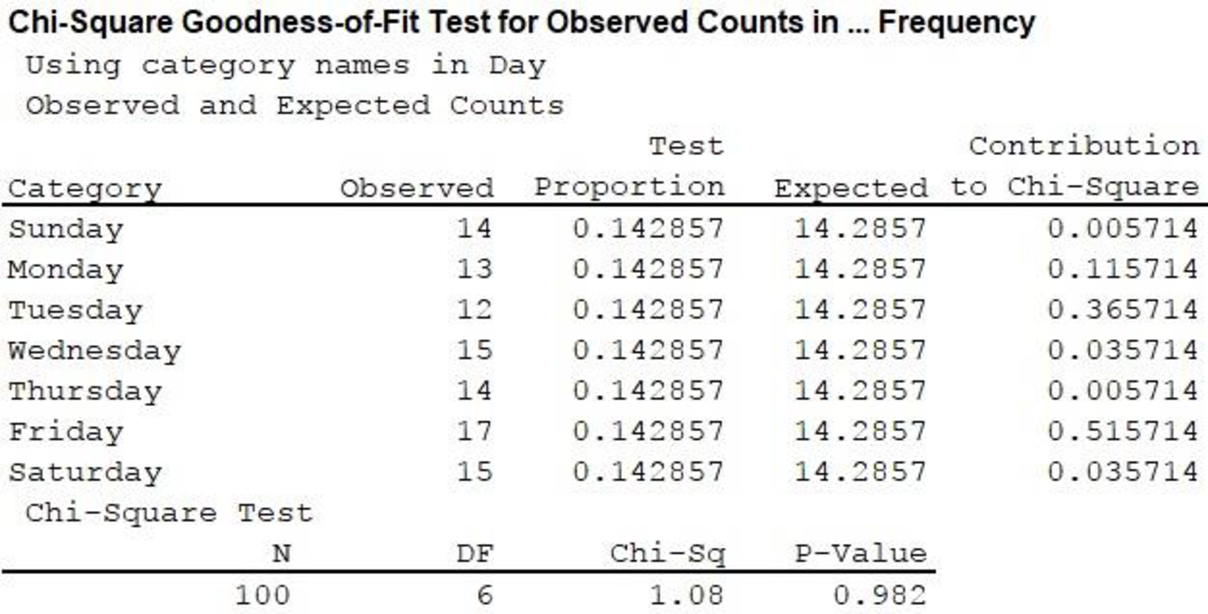
From the output,
8. P-value:
From the MINITAB output, P-value is 0.982.
9. Conclusion:
Decision rule:
- If P-value is less than or equal to the level of significance, reject the null hypothesis.
- Otherwise fail to reject the null hypothesis.
Conclusion:
Here the level of significance is 0.05.
Here, P-value is greater than the level of significance.
That is,
Therefore, fail to reject the null hypothesis.
Thus, the data do not provide any sufficient evidence that at least one of the population proportion is not equal to
Hence, there is no convincing evidence that the proportion of accidents is not same for all the days of the week.
Want to see more full solutions like this?
Chapter 12 Solutions
INTRODUCTION TO STATISTICS & DATA ANALYS


 Holt Mcdougal Larson Pre-algebra: Student Edition...AlgebraISBN:9780547587776Author:HOLT MCDOUGALPublisher:HOLT MCDOUGAL
 Glencoe Algebra 1, Student Edition, 9780079039897...AlgebraISBN:9780079039897Author:CarterPublisher:McGraw Hill