![WebAssign for Rosner's Fundamentals of Biostatistics, 8th Edition [Instant Access], Single-Term](https://s3.amazonaws.com/compass-isbn-assets/textbook_empty_images/large_textbook_empty.svg)
WebAssign for Rosner's Fundamentals of Biostatistics, 8th Edition [Instant Access], Single-Term
8th Edition
ISBN: 9780357452905
Author: Rosner
Publisher: Cengage Learning US
expand_more
expand_more
format_list_bulleted
Concept explainers
Videos
Textbook Question
Chapter 12, Problem 43P
Gastroenterology
In Table 12.39, we present data relating protein concentration to pancreatic
Table 12.39 Relationship between protein concentration (mg/mL) of duodenal secretions to pancreatic function as measured by trypsin secretion [U/(kg/hr)]
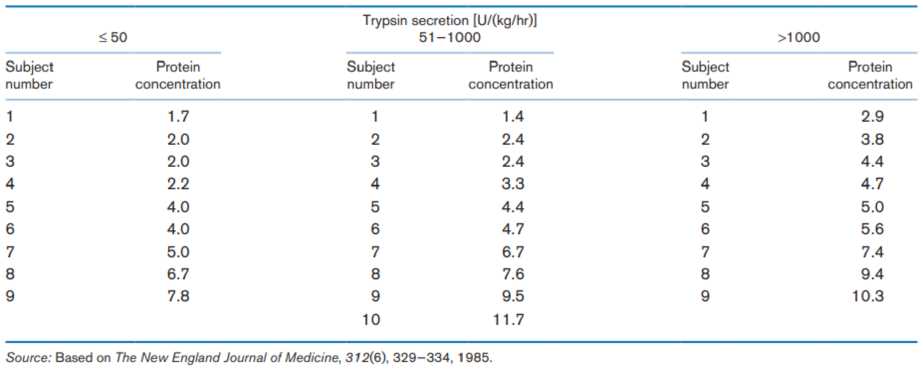
Perform the test mentioned in Problem 12.42, and report a p-value. How do your results compare with a parametric analysis of the data?
If we do not want to assume normality for these distributions, then what statistical procedure can be used to compare the three groups?
Expert Solution & Answer

Trending nowThis is a popular solution!

Students have asked these similar questions
OphthalmologyRetinitis pigmentosa (RP) is a hereditary ocular diseasein which patches of pigment appear on the retina, potentially resulting in substantial vision loss and in somecases complete blindness. An important issue is how fastthe subjects decline. Visual field is an important measureof area of vision, which is measured in degree2. A visualfield area for a normal person is around 11,000 degree2.The longitudinal data in Table 11.29 were provided by anindividual patient.Table 11.29 Longitudinal visual field data forone RP patientTime Visual field area lnVisit (yr) (degree2) (visual field area)1 0 3059 8.032 1 3053 8.023 2 1418 7.264 3 1692 7.435 4 1978 7.596 5 1567 7.367 6 1919 7.568 7 1998 7.609 11 1648 7.4110 13 1721 7.4511 15 1264 7.14mean 6.09 1938 7.532sd 4.97 597 0.280Suppose the rate of change of ln (visual field) is a linearfunction of follow-up time.11.103 Write down a linear regression model that summarizes this relationship.11.104 Fit the regression line using…
11. Below is a table from the journal article "Acute Effects of Electronic Cigarette Aerosol Inhalation on
Vascular Function Detected at Quantitative MRI" by Caporale, et. al. from Radiology 2019. Nonsmokers
were asked to inhale nicotine-free e-cigarette aerosol, and variables were measured.
Effects of Electronic Cigarette Aerosol Inhalation on Vascular Function
Table 4: Comparisons before and after E-cigarette Vaping
MRI Parameters
Before E-cigarette Vaping
After E-cigarette Vaping
P Value
Peripheral vascular reactivity
Dynamic superficial femoral vein oximetry (SvO,)
Baseline SvO, (96HBO,)
Washout time (sec)
52 2
7.6 0.2
65 2
<.001
9.1 0.4
3.0 0.2
19 2
.001
Upslope (96H60 /sec)
Overshoot (%HbO,)
Peak-to-peak SvO, (%HbO_)
Superficial femoral artery blood flow velocity
Resistivity index
Peak velocity (cm/sec)
Time to peak (sec)
Hyperemic index (cm/sec)
Vessel wall imaging
FMD, (%)
Cerebrovascular reactivity
Breath-hold index (cm/sec)
Post-breath hold relative velocity increase (%)…
Ophthalmology Retinitis pigmentosa (RP) is a hereditary ocular disease in which patches of pigment appear on the retina, potentially resulting in substantial vision loss and in some cases complete blindness. An important issue is how fast the subjects decline. Visual field is an important measure of area of vision, which is measured in degree2. A visual field area for a normal person is around 11,000 degree2. The longitudinal data in Table 11.29 were provided by an individual patient. tablE 11.29 Longitudinal visual field data for one RP patient Time Visual field area ln Visit (yr) (degree2) (visual field area) 1 0 3059 8.03 2 1 3053 8.02 3 2 1418 7.26 4 3 1692 7.43 5 4 1978 7.59 6 5 1567 7.36 7 6 1919 7.56 8 7 1998 7.60 9 11 1648 7.41 10 13 1721 7.45 11 15 1264 7.14 mean 6.09 1938 7.532 sd 4.97 597 0.280 Suppose the rate of change of ln (visual field) is a linear function of follow-up time. 11.103 Write down a linear regression model that summarizes…
Chapter 12 Solutions
WebAssign for Rosner's Fundamentals of Biostatistics, 8th Edition [Instant Access], Single-Term
Ch. 12 - Nutrition Researchers compared protein intake...Ch. 12 - Nutrition Researchers compared protein intake...Ch. 12 - Prob. 3PCh. 12 - Prob. 4PCh. 12 - Prob. 5PCh. 12 - Pulmonary Disease Twenty-two young asthmatic...Ch. 12 - Pulmonary Disease Twenty-two young asthmatic...Ch. 12 - Prob. 8PCh. 12 - Prob. 32PCh. 12 - Gastroenterology In Table 12.39, we present data...
Knowledge Booster


Learn more about
Need a deep-dive on the concept behind this application? Look no further. Learn more about this topic, statistics and related others by exploring similar questions and additional content below.Similar questions
- What does the y -intercept on the graph of a logistic equation correspond to for a population modeled by that equation?arrow_forwardIn this question you are asked to help the ministry of labor to analyze US wage data for females (X;) and males (Y;). The data used are based on a sample of 526 observations where 252 of them are females: The following average hourly earnings observations are at hand: = 1156.090 E(x; – x)2 = 1605.817 Ey: = 1945.260 EGi – y)² = 4726.378 a) Test the wage discrimination hypothesis that wages are higher for males at a 1% significance level. What can you say about the p-value of this test? b) Calculate the power for the test in b) when the population differences in wages uy - ux equal to: 0.100, 0.250, 0.500, 1.000, 1.500. Also, use the results to plot the power function curve.arrow_forwardThe data in Table 7..7 are collected in an experiment designed to investigate the impact of different positions of the mother during ultrasound on fetal heart rate. Fetal heart rate is measured by ultrasound in beats per minute. The study includes 20 women who are each assigned to one position and have the fetal heart rate measured in that position. Each woman is between 28 weeks, and 32 weeks, gestation. Is there a significant difference in mean fetal heart rates by position? Run the test at a 5% level of significance. PLEASE SHOW THE ANSWER IN EXCEL FORMAT WITH FORMULAS.arrow_forward
- Question 19arrow_forward32)arrow_forwardRecently, researchers have begun to focus on the relationship between potentially toxic environmental exposures in children to a number of adverse health outcomes. Suppose one such researcher wants to investigate the relationship between lead levels in soil (micrograms/dL) and BMI (kg/m2). The following table represents a SRS of households with the corresponding exterior lead levels and BMI of a randomly sampled child in the home. Lead levels BMI 13.6 19.7 14.3 19.9 9.7 20.1 9.4 22.1 11.4 19.8 10.9 21.6 A) Write out the null and alternative hypotheses for a formal test of significance testing the correlation between the two variables and calulate a t statistic and interpret your pvalue and results.arrow_forward
- QUESTION 11 Researchers look at the difference of proportions between two groups. Group 1 included 1927 people, of whom 689 were female. Group 2 included 541 people, of whom 160 were female. Calculate the difference of proportions. |nj = 1927 n2=541 x1 = 689 X2 160 O 0.382 O 0.062 O0.62 O0.214 QUESTION 12 A group of researchers are interested in differences in stress levels between nurse practitioners and physical therapists. A randomly selected group of each was given a survey. The resulrs are below. 111 Nurse Practitioners n1 = 173 mean stress score 77,4 sample standard de --i-- - 11 Physical Therapists n2 = 109 mean stress score = 77,91 Which of the followi cick Saue and Submit to sove and submit. Chck Save All Answers to save all answers. Type here to searcharrow_forwardGn. Don't provide handwriting solutionarrow_forwardtion question Figure 2 shows the relationship in Africa between annual all-cause mortality rates in children ages 0-4 and P. falciparum malaria transmission intensity. Regions are classified into one of four categories based on childhood malaria prevalence: 1 childhood infection prevalence ranges from 0-24% 2-childhood infection prevalence ranges from 25-50% 3-childhood infection prevalence ranges from 51-74% 4-childhood infection prevalence ranges from 75-100% Annual mortality rate/1000 80 60 40 20 10 1 2 3 4 Intensity of P. falciparum transmissionarrow_forward
- Kindly answer part 3 of this question.arrow_forward1.arrow_forwardQuestion 4 Beachcomber Ltd in a local car dealership that sells used and new vehicles. The manager of the company wants to know how different variables affect the sales of his vehicles. A random sample of yearly data was taken with the view to testing the model: SALES-a+BAGE+YMIL+8ENG Where SALES= amount that a vehicle is sold for(S000's), AGE = age of the vehicle, MIL= the total mileage of the vehicle at the point of sale and ENG = the size of the engine. The sample of data was processed using MINITAB and the following is an extract of the output obtained: The regression equation is ***** Coef StDev t-ratio p-value Predict or Constan 1.7586 0.2525 6.9648 0.0000 t AGE 0.2124 0.3175 0.5042 MIL 0.3586 -2.0991 0.7527 ENG 4.8124 0.6196 7.7664 0.0000 Analysis of Variance Source DF MS Regressi 413.1291 138.709 0.00 on Error 50 457.7607 2.2888 Total 53 a) What is dependent and independent variables? b) Fully write out the regression equation c) Fill in the missing values , *, d) Hence test…arrow_forward
arrow_back_ios
SEE MORE QUESTIONS
arrow_forward_ios
Recommended textbooks for you
 Linear Algebra: A Modern IntroductionAlgebraISBN:9781285463247Author:David PoolePublisher:Cengage Learning
 Glencoe Algebra 1, Student Edition, 9780079039897...AlgebraISBN:9780079039897Author:CarterPublisher:McGraw Hill
 Big Ideas Math A Bridge To Success Algebra 1: Stu...AlgebraISBN:9781680331141Author:HOUGHTON MIFFLIN HARCOURTPublisher:Houghton Mifflin Harcourt
Linear Algebra: A Modern Introduction
Algebra
ISBN:9781285463247
Author:David Poole
Publisher:Cengage Learning
Glencoe Algebra 1, Student Edition, 9780079039897...
Algebra
ISBN:9780079039897
Author:Carter
Publisher:McGraw Hill
Big Ideas Math A Bridge To Success Algebra 1: Stu...
Algebra
ISBN:9781680331141
Author:HOUGHTON MIFFLIN HARCOURT
Publisher:Houghton Mifflin Harcourt
Statistics 4.1 Point Estimators; Author: Dr. Jack L. Jackson II;https://www.youtube.com/watch?v=2MrI0J8XCEE;License: Standard YouTube License, CC-BY
Statistics 101: Point Estimators; Author: Brandon Foltz;https://www.youtube.com/watch?v=4v41z3HwLaM;License: Standard YouTube License, CC-BY
Central limit theorem; Author: 365 Data Science;https://www.youtube.com/watch?v=b5xQmk9veZ4;License: Standard YouTube License, CC-BY
Point Estimate Definition & Example; Author: Prof. Essa;https://www.youtube.com/watch?v=OTVwtvQmSn0;License: Standard Youtube License
Point Estimation; Author: Vamsidhar Ambatipudi;https://www.youtube.com/watch?v=flqhlM2bZWc;License: Standard Youtube License