
Fundamentals of Biostatistics
8th Edition
ISBN: 9781305268920
Author: Bernard Rosner
Publisher: Cengage Learning
expand_more
expand_more
format_list_bulleted
Concept explainers
Videos
Textbook Question
Chapter 12, Problem 43P
Gastroenterology
In Table 12.39, we present data relating protein concentration to pancreatic
Table 12.39 Relationship between protein concentration (mg/mL) of duodenal secretions to pancreatic function as measured by trypsin secretion [U/(kg/hr)]
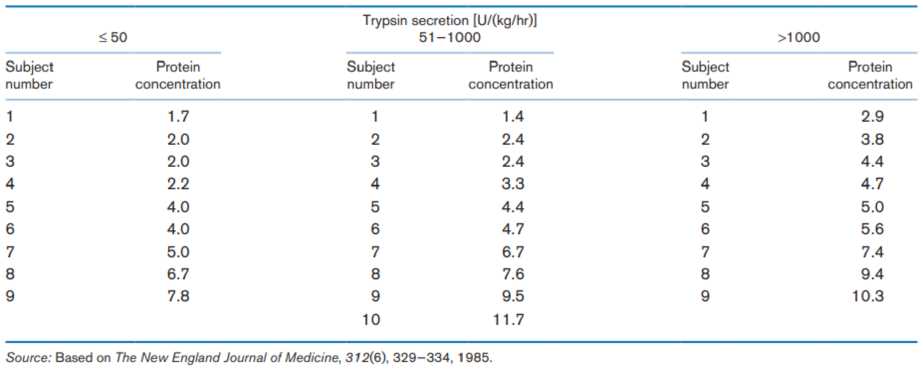
Perform the test mentioned in Problem 12.42, and report a p-value. How do your results compare with a parametric analysis of the data?
If we do not want to assume normality for these distributions, then what statistical procedure can be used to compare the three groups?
Expert Solution & Answer

Trending nowThis is a popular solution!

Students have asked these similar questions
QUESTION 25
A clinical trial is being conducted in order to determine the efficacy of a new drug used to treat Rheumatoid arthritis. The efficacy of the medication will not only be determined by the physical improvement of symptoms but also by using a blood test to examine the concentration C-reactive protein (an inflammatory marker) in an individual’s blood. If the researcher wants a margin of error for the level of C-reactive protein to be less than or equal to 3.0 mg/dL, and if the standard deviation for C-reactive protein concentrations among arthritis patients was previously documented at 8 mg/dL, how many patients should be recruited for each group in the study assuming a 95% confidence interval will be used to quantify the mean differences between the control group and the treatment group?
nfor the treatment group = 112; n for the control group = 111
nfor the treatment group = 56; n for the control group = 57
nfor the treatment group = 55; n…
Question 7
Consider a cohort study to compare the mortality rate of myocardial infarction (MI) in men with sedentary work (exposed group) to men with physically active work (unexposed). If in the exposed, there were 36,000 person (man) years of observation and 126 deaths whereas the unexposed had 24,000 man-years of observation and 44 deaths.
Compute the following
a) Mortality rate in each cohort?
b) What is the relative risk of dying, comparing these 2 groups?
c) What is the attributable risk of sedentary work?
d) What is the attributable benefit of physical activity?
e) If we assume that MI is associated with the mortality in this cohort (causality), what proportion of the disease in the higher group is potentially preventable?
Refer the data in images
Problem a)What is the appropriate test procedure to test for significant differences in mean white blood cell count between people who do and people who do not receive a bacterial culture?Problem b) Perform the procedure in Problem a using thecritical-value method.Problem c) What is the p-value corresponding to your answer toProblem b ?
Chapter 12 Solutions
Fundamentals of Biostatistics
Ch. 12 - Nutrition Researchers compared protein intake...Ch. 12 - Nutrition Researchers compared protein intake...Ch. 12 - Prob. 3PCh. 12 - Prob. 4PCh. 12 - Prob. 5PCh. 12 - Pulmonary Disease Twenty-two young asthmatic...Ch. 12 - Pulmonary Disease Twenty-two young asthmatic...Ch. 12 - Prob. 8PCh. 12 - Prob. 32PCh. 12 - Gastroenterology In Table 12.39, we present data...
Knowledge Booster


Learn more about
Need a deep-dive on the concept behind this application? Look no further. Learn more about this topic, statistics and related others by exploring similar questions and additional content below.Similar questions
- Repeat Example 5 when microphone A receives the sound 4 seconds before microphone B.arrow_forwardquestion (9): A researcher was interested in the effect of job security on stress. The researcher recruited a random sample of 10 individuals who had job security and 10 individuals who were employed on a 1 year contract. The researcher measured the stress hormone through a saliva sample. This is an independent sample design; TRUE OR FALSEarrow_forwardA dietitian wishes to see if a person’s cholesterol level will be changed if the diet is supplemented by a certain mineral. Four subjects were pre-tested, and they took the mineral supplement for a 6-week period. The results are shown in the table. Is there sufficient evidence to conclude that the population mean of cholesterol levels has been changed after six weeks at α=0.2α=0.2? Assume that the differences are from an approximately normally distributed population. Subject Cholestrol Level (mg/dl) Cholestrol Level after 6 Weeks (mg/dl) dd ¯dd¯ (d−¯d)2(d-d¯)2 1 206 217 11 2 219 184 -35 3 202 204 2 4 213 205 -8 Total -30 a) Calculate the mean, the sum of the squared deviation from the mean, and the standard deviation of differences. Do not include the unit for each answer: ¯d=d¯= (do not round) ∑(d−¯d)2=∑(d-d¯)2= (do not round) sd=sd= (rounded to one decimal place) b) Perform the hypothesis test in the following steps: Step 1.…arrow_forward
- Drop-off points (points de collecte in French), where residents can dispose of their organic waste for composting, were established in each of the five targeted neighborhoods of PROBLEM 1. Camille wants to see whether or not there exists a relationship between the average weekly amount of non-disposed food waste per household and the availability of drop-off points in the neighborhood, expressed as the number of households per drop-off point (considered fixed). Her data and some of her preliminary calculations are presented below: Camille also calculated the slope of the fitted regression line: estimated slope = 0.008. Test whether or not the availability of drop-off points in the neighborhood has a linear effect on the amount of non-disposed food waste per household. Use α = 0.10.arrow_forwardStep 2: Determine if r is statistically significant at 0.01 and 0.05 levels.arrow_forwardAlthough the Excel regression output, shown in Figure 12.21 for Demonstration Problem 12.1, is somewhat different from the Minitab output, the same essential regression features are present. The regression equation is found under Coefficients at the bottom of ANOVA. The slope or coefficient of x is 2.2315 and the y-intercept is 30.9125. The standard error of the estimate for the hospital problem is given as the fourth statistic under Regression Statistics at the top of the output, Standard Error = 15.6491. The r2 value is given as 0.886 on the second line. The t test for the slope is found under t Stat near the bottom of the ANOVA section on the “Number of Beds” (x variable) row, t = 8.83. Adjacent to the t Stat is the p-value, which is the probability of the t statistic occurring by chance if the null hypothesis is true. For this slope, the probability shown is 0.000005. The ANOVA table is in the middle of the output with the F value having the same probability as the t statistic,…arrow_forward
arrow_back_ios
arrow_forward_ios
Recommended textbooks for you
 Glencoe Algebra 1, Student Edition, 9780079039897...AlgebraISBN:9780079039897Author:CarterPublisher:McGraw Hill
 Trigonometry (MindTap Course List)TrigonometryISBN:9781337278461Author:Ron LarsonPublisher:Cengage Learning
Glencoe Algebra 1, Student Edition, 9780079039897...
Algebra
ISBN:9780079039897
Author:Carter
Publisher:McGraw Hill
Trigonometry (MindTap Course List)
Trigonometry
ISBN:9781337278461
Author:Ron Larson
Publisher:Cengage Learning
Statistics 4.1 Point Estimators; Author: Dr. Jack L. Jackson II;https://www.youtube.com/watch?v=2MrI0J8XCEE;License: Standard YouTube License, CC-BY
Statistics 101: Point Estimators; Author: Brandon Foltz;https://www.youtube.com/watch?v=4v41z3HwLaM;License: Standard YouTube License, CC-BY
Central limit theorem; Author: 365 Data Science;https://www.youtube.com/watch?v=b5xQmk9veZ4;License: Standard YouTube License, CC-BY
Point Estimate Definition & Example; Author: Prof. Essa;https://www.youtube.com/watch?v=OTVwtvQmSn0;License: Standard Youtube License
Point Estimation; Author: Vamsidhar Ambatipudi;https://www.youtube.com/watch?v=flqhlM2bZWc;License: Standard Youtube License