
(a)
To find: The expression of contrast for each of the treatments in terms of their respective means.
(a)
Answer to Problem 49E
Solution: The expression of contrast for the experiment including the treatment of Placebo verses average of two low dose treatment is given below:
The expression of contrast for the experiment including the treatment of difference between high A and low A verses high B and low B is given below:
Explanation of Solution
Calculation: The average of means of low A and low B treatment is
Null hypotheses represent that there is no difference in the Placebo treatment and average of low A and low B treatment, which is represented as below:
Hence, on equating
The difference of means of low A and high A treatment is
Null hypotheses represent that there is no difference in the difference of low A and high A treatment and difference of high B and low B treatment, which is represented as below:
Hence, on equating
The coefficients of contrast for the contrast
The coefficients of contrast for the contrast
(b)
To find: The sample and standard error for each of the contrast.
(b)
Answer to Problem 49E
Solution: The sample of contrast
The standard error for the contrast
Explanation of Solution
Calculation: The value of contrast
The value of contrast
Standard error can be calculated by using the formula given below:
Pooled standard deviation can be calculated as given below:
For the first contrast, the standard error
For the second contrast, the standard error
Interpretation: Therefore, it can be concluded that for the first contrast, the estimated value of standard deviation is 2.1353 and for the second contrast, the estimated value of standard deviation is 3.487.
(c)
To test: The significance test for each of the contrast and summarize the obtained results.
(c)
Answer to Problem 49E
Solution: The test statistic for contrast of the experiment including the treatment of Placebo verses average of two low dose treatment is 0.0414 and the test statistics for contrast for the experiment including the treatment of difference between high A and low A verses high B and low B is 0.2540. For the first contrast, the result is significant but for the second contrast the result is insignificant.
Explanation of Solution
Calculation: Test statistic can be calculated by using following formula, which is mentioned below:
To calculate the test statistic for first contrast, the value of
The total sample size of rats is 25. There are five groups, which are represented by k.
The degree of freedom for contrast can be obtained as shown below:
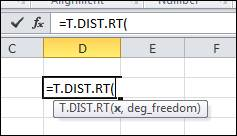
The P-value can also be calculated by the software Microsoft Excel by using the following command:
Insert the values of x and degree of freedom, which are –1.8264 and 20, respectively. After this, press enter and the output is shown below in the snapshot:
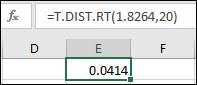
Hence, the P- value is obtained as 0.0414, which is less than the significance level 0.05, so the decision is to reject the null hypothesis.
To calculate the test statistic for second contrast, the value of
The P-value can also be calculated by the software Microsoft Excel by using the following command:
Insert the values of x and degree of freedom, which is 0.6739 and 20, respectively. After this, press enter and the output is shown below in the snapshot:
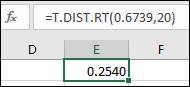
Hence, the P- value is obtained as 0.2540, which is greater than the significance level 0.05, so the decision is to accept the null hypothesis.
Conclusion: Therefore, it can be concluded that the result is significant for the first contrast and the result is not significant for the second contrast.
Want to see more full solutions like this?
Chapter 12 Solutions
LaunchPad for Moore's Introduction to the Practice of Statistics (12 month access)

 MATLAB: An Introduction with ApplicationsStatisticsISBN:9781119256830Author:Amos GilatPublisher:John Wiley & Sons Inc
 Probability and Statistics for Engineering and th...StatisticsISBN:9781305251809Author:Jay L. DevorePublisher:Cengage Learning
 Statistics for The Behavioral Sciences (MindTap C...StatisticsISBN:9781305504912Author:Frederick J Gravetter, Larry B. WallnauPublisher:Cengage Learning
 Elementary Statistics: Picturing the World (7th E...StatisticsISBN:9780134683416Author:Ron Larson, Betsy FarberPublisher:PEARSON
 The Basic Practice of StatisticsStatisticsISBN:9781319042578Author:David S. Moore, William I. Notz, Michael A. FlignerPublisher:W. H. Freeman
 Introduction to the Practice of StatisticsStatisticsISBN:9781319013387Author:David S. Moore, George P. McCabe, Bruce A. CraigPublisher:W. H. Freeman